Infographics about traffic visually represent data on vehicle flow, congestion patterns, and road safety statistics to provide clear insights into urban mobility. These graphics help identify peak traffic hours, accident hotspots, and the effectiveness of traffic management strategies. By simplifying complex information, they enable better decision-making for city planners and drivers alike.
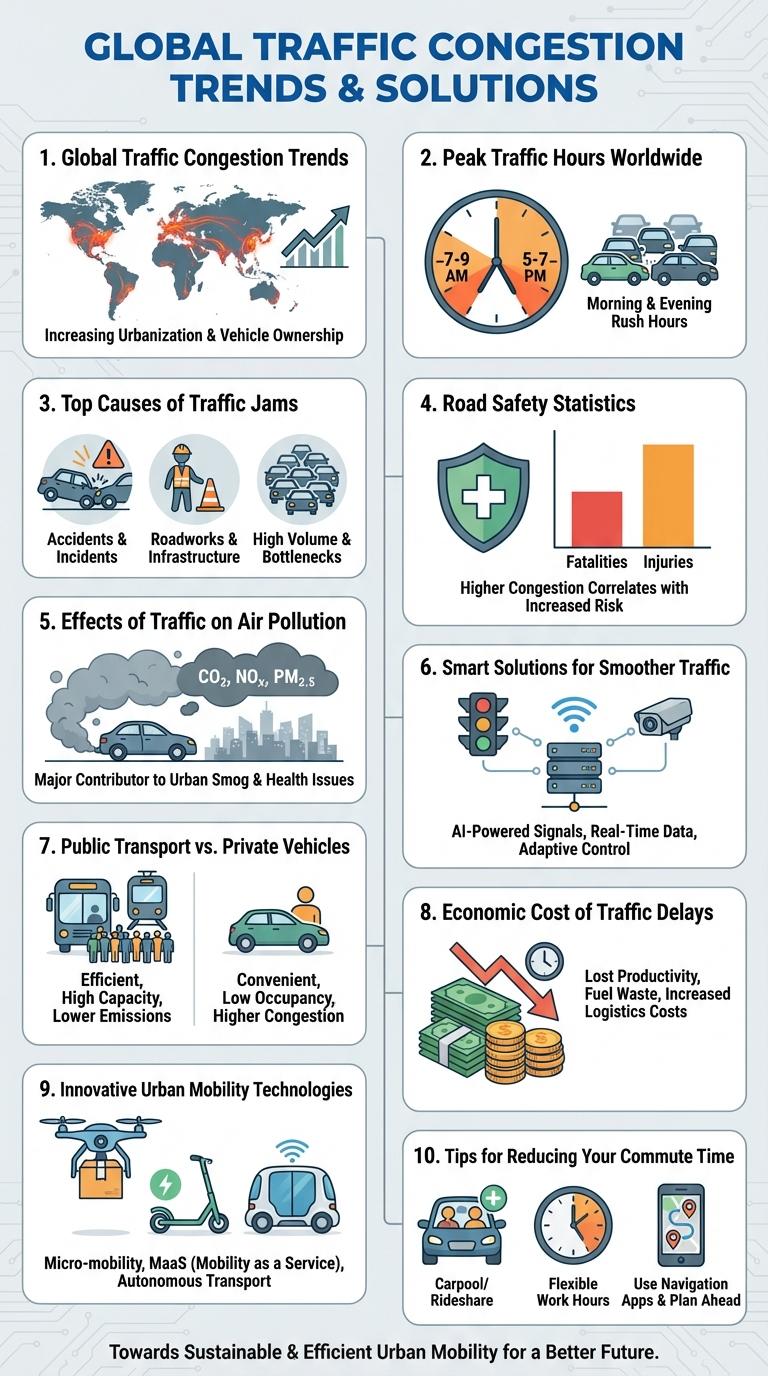
Global Traffic Congestion Trends
Global traffic congestion has surged by over 20% in the past decade, with megacities like Mumbai and Los Angeles experiencing the highest delays. Urbanization and increased vehicle ownership contribute significantly to longer commute times and elevated pollution levels worldwide. Implementing smart traffic management and public transportation improvements remains critical to alleviating these growing challenges.
Peak Traffic Hours Worldwide
Global traffic patterns reveal distinct peak hours varying by region. Understanding these peak times aids in traffic management and urban planning.
In major cities, morning rush hours typically span from 7 AM to 10 AM, while evening traffic peaks between 4 PM and 7 PM. These time frames coincide with standard workday schedules worldwide, causing congestion on primary roadways and public transit systems.
Top Causes of Traffic Jams
Traffic jams primarily result from road congestion caused by high vehicle volumes during peak hours. Accidents and road construction create sudden disruptions, leading to bottlenecks and slowdowns. Poor traffic management systems and driver behavior, such as abrupt lane changes and distracted driving, further exacerbate traffic delays.
Road Safety Statistics
Road safety remains a critical concern worldwide, with millions affected by traffic-related incidents each year. Understanding key statistics helps in creating effective measures to reduce accidents and save lives.
- Global Road Fatalities - Over 1.3 million people die annually due to road traffic crashes worldwide.
- Injury Rates - Road traffic injuries are among the top causes of death for people aged 5-29 years.
- Seat Belt Usage - Wearing seat belts reduces the risk of fatal injury by 45% for front-seat occupants.
Effects of Traffic on Air Pollution
How does traffic contribute to air pollution?
Vehicle emissions release harmful pollutants such as nitrogen oxides (NOx) and particulate matter (PM) into the atmosphere. These pollutants degrade air quality and pose significant health risks to urban populations.
Smart Solutions for Smoother Traffic
Smart traffic solutions use advanced technologies like AI, IoT, and data analytics to reduce congestion and improve road safety. Real-time traffic monitoring helps optimize signal timings, leading to smoother vehicle flow.
Adaptive traffic lights and connected vehicle systems prioritize emergency vehicles and public transit, reducing delays. These innovations contribute to lower emissions and enhanced commuter experiences in urban areas.
Public Transport vs. Private Vehicles
| Aspect | Public Transport vs. Private Vehicles |
|---|---|
| Environmental Impact | Public transport produces significantly lower CO2 emissions per passenger compared to private vehicles. |
| Space Efficiency | Public transport carries more passengers in less space, reducing congestion on roads. |
| Cost | Public transport offers lower daily commuting costs versus expenses like fuel, parking, and maintenance for private vehicles. |
| Traffic Congestion | Private vehicles contribute heavily to urban traffic jams, while public transport decreases the number of cars on the road. |
| Reliability & Speed | Public transport can face delays, but priority lanes and schedules often improve overall commute time compared to solo driving in heavy traffic. |
Economic Cost of Traffic Delays
Traffic delays impose a significant economic burden on urban areas worldwide. These delays reduce productivity, increase fuel consumption, and elevate transportation costs.
- Lost Productivity - Traffic congestion leads to millions of hours lost annually, directly impacting workforce efficiency and business operations.
- Increased Fuel Costs - Vehicles idling in traffic consume more fuel, raising expenses for drivers and contributing to higher overall transportation costs.
- Impact on Goods Delivery - Delays disrupt supply chains, causing increased delivery times and higher shipping costs, which affect market prices.
Innovative Urban Mobility Technologies
Innovative urban mobility technologies are transforming city traffic with smart solutions. These advancements aim to reduce congestion, enhance safety, and promote sustainable transportation methods.
Key innovations include electric scooters, autonomous vehicles, and smart traffic management systems using AI. Electric scooters provide flexible last-mile connectivity while reducing carbon emissions. Autonomous vehicles optimize traffic flow by minimizing human error and improving road safety.