Infographics effectively transform complex data into visually engaging and easily understandable graphics by combining images, charts, and minimal text. They enhance information retention and simplify communication across various fields such as education, marketing, and journalism. Clear design and relevant content are crucial for maximizing the impact of infographics on the target audience.
Definition and Purpose of Infographics
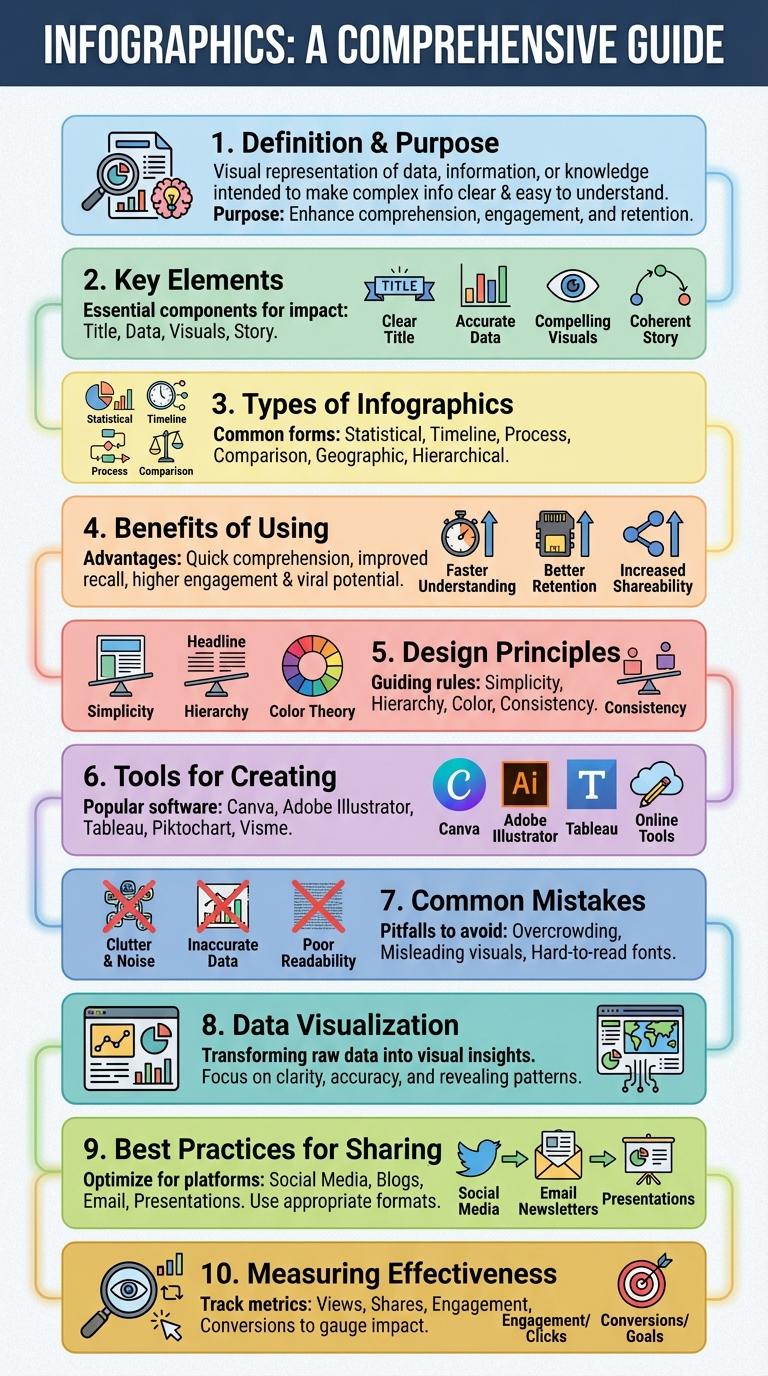
Infographics are visual representations of information, data, or knowledge designed to present complex information quickly and clearly. They blend text, images, and design elements to simplify the communication of facts and figures. The primary purpose of infographics is to enhance understanding and retention by making data more accessible and engaging.
Key Elements of Effective Infographics
What are the key elements that make an infographic effective? An effective infographic combines clear visual hierarchy with concise data presentation to engage viewers. It emphasizes simplicity and visual appeal to communicate complex information quickly and clearly.
How important is clarity in an infographic? Clarity ensures the audience easily understands the message without confusion. Using clean design, readable fonts, and straightforward data visualization enhances overall comprehension.
Why is data accuracy essential in infographics? Accurate data builds trust and credibility with the audience. Misrepresented or outdated information can mislead viewers and damage the infographic's reliability.
What role does color play in infographics? Colors guide the viewer's attention and help distinguish different data categories. Proper color contrast improves readability and reinforces the infographic's overall message.
How does layout influence an infographic's effectiveness? A well-organized layout directs the viewer through the information smoothly. Balanced spacing, alignment, and logical flow contribute to a positive user experience.
Types of Infographics
Infographics are visual representations of information designed to make complex data easily understandable. They combine graphics, charts, and text to communicate messages quickly and effectively.
There are several types of infographics, each serving a unique purpose for different kinds of data presentation. Common types include statistical, informational, process, timeline, and comparison infographics.
Benefits of Using Infographics
Infographics are visual representations combining data and design to communicate information quickly and clearly. They enhance understanding by presenting complex information in an engaging and easily digestible format.
- Improves Information Retention - Visual elements help viewers remember data more effectively than text alone.
- Simplifies Complex Data - Infographics break down complicated concepts into manageable, visually appealing parts.
- Enhances Engagement - Eye-catching designs attract attention and encourage sharing on digital platforms.
Infographic Design Principles
Infographic design principles guide the creation of clear and visually appealing graphics that communicate data effectively. These principles help simplify complex information, making it easier for audiences to understand and retain key messages.
- Clarity - Use concise text and straightforward visuals to ensure the message is easily understood.
- Consistency - Maintain uniform colors, fonts, and styles to create a cohesive look throughout the infographic.
- Hierarchy - Organize information by importance to direct viewers' attention to the most critical data first.
Tools for Creating Infographics
Infographics are visual representations of information designed to make complex data easy to understand. They combine images, charts, and minimal text to communicate messages quickly and clearly.
Several tools are available for creating infographics, each offering various features and ease of use. Canva provides customizable templates suitable for beginners and professionals. Piktochart specializes in data visualization with drag-and-drop functions. Adobe Illustrator offers advanced design capabilities for detailed and customized graphics. Venngage is ideal for creating infographics with interactive elements and a wide range of icons and charts.
Common Mistakes in Infographic Design
Infographics are visual representations of information designed to make data easily understandable and engaging. Common mistakes in infographic design include overcrowding with excessive text or graphics, which overwhelms the viewer and dilutes the message. Poor color choices and inconsistent fonts can reduce readability and fail to highlight key data points effectively.
Infographics for Data Visualization
Infographics for data visualization transform complex data into clear, engaging visual stories. They enhance understanding through graphical representation, making information accessible to diverse audiences.
- Simplify Complex Data - Infographics break down large datasets into easy-to-interpret visuals that highlight key points.
- Enhance Retention - Visual elements improve memory retention by combining images with concise text and statistics.
- Support Decision Making - Clear visualization helps stakeholders analyze trends and patterns quickly for informed decisions.
Effective infographics merge art and data science to communicate insights efficiently.
Best Practices for Infographic Sharing
Infographics are visual representations that combine data and design to communicate information clearly and quickly. Effective sharing of infographics boosts engagement and broadens audience reach.
Best practices for infographic sharing include optimizing file size for fast loading and ensuring mobile responsiveness. Using relevant keywords and compelling descriptions enhances discoverability on platforms.