GDP measures the total value of goods and services produced within a country, serving as a key indicator of economic health. Infographics provide a clear and concise visual representation of GDP data, making complex information easier to understand. By highlighting trends and comparisons, these visuals help businesses, policymakers, and individuals grasp the dynamics of economic growth.
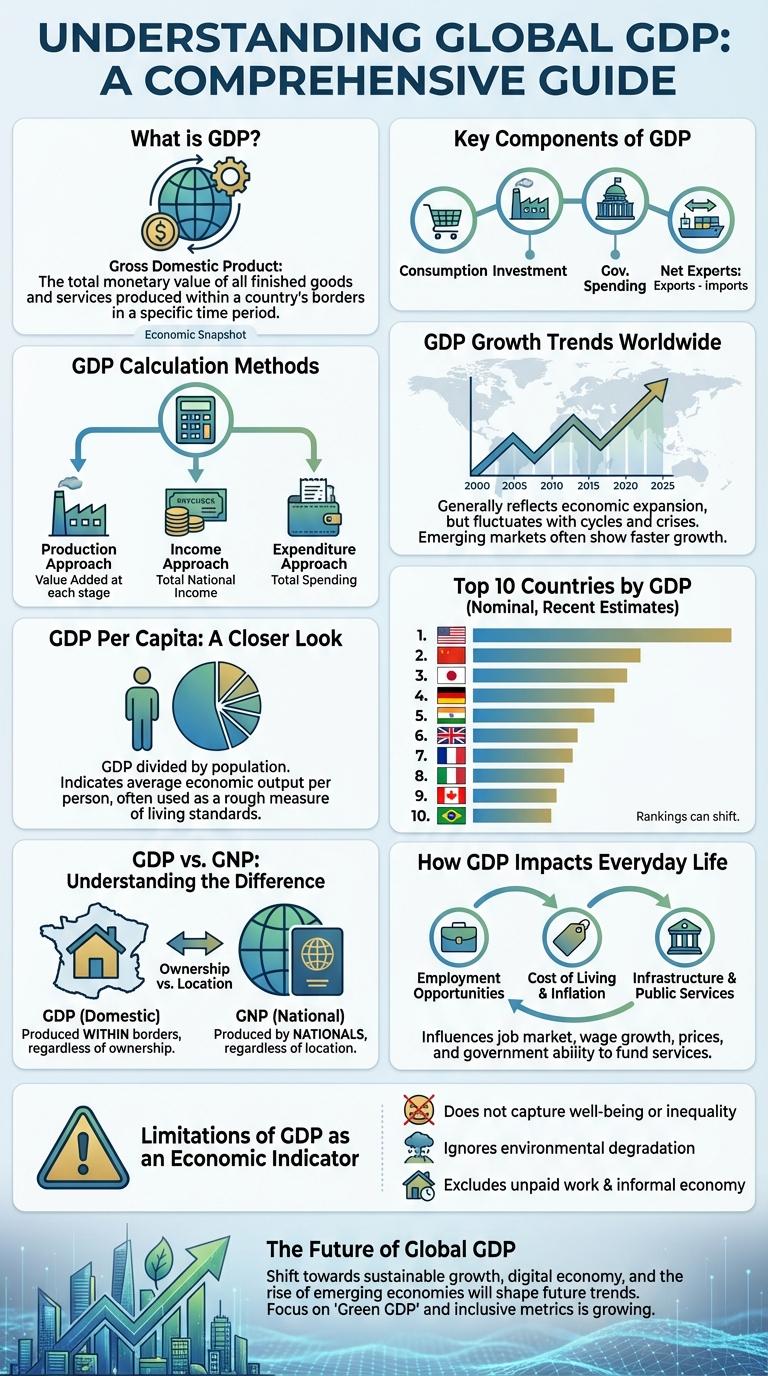
What is GDP?
Gross Domestic Product (GDP) measures the total value of all goods and services produced within a country's borders in a specific time period. It serves as a key indicator of a nation's economic health and performance.
GDP includes consumption, investment, government spending, and net exports (exports minus imports). Economists use GDP data to compare economic activity across countries and track growth trends over time.
Key Components of GDP
| Key Component | Description |
|---|---|
| Consumption (C) | Spending by households on goods and services, such as food, rent, healthcare, and entertainment. |
| Investment (I) | Expenditures on business capital, residential construction, and inventories that contribute to future production. |
| Government Spending (G) | Government expenditures on goods and services, including infrastructure, defense, and public education. |
| Net Exports (NX) | Exports minus imports; value of goods and services sold abroad minus those purchased from other countries. |
GDP Calculation Methods
Gross Domestic Product (GDP) measures the total economic output of a country within a specific period. It reflects the market value of all final goods and services produced domestically.
GDP calculation involves three primary methods: the production approach, the expenditure approach, and the income approach. Each method provides a different perspective but should result in the same GDP figure.
GDP Growth Trends Worldwide
Global GDP growth trends reveal significant variations across continents and economic sectors. Understanding these patterns aids policymakers in making informed decisions to foster sustainable development.
Asia leads global GDP growth, driven by rapid industrialization and technological innovation. Africa shows promising growth rates due to expanding infrastructure and rising consumer markets. Developed regions like North America and Europe experience moderate growth, influenced by mature industries and demographic shifts.
GDP Per Capita: A Closer Look
GDP per capita measures the average economic output per person in a country. It is a key indicator for comparing living standards across different nations.
This metric divides the Gross Domestic Product (GDP) by the total population, providing insight into individual prosperity levels.
- Economic Benchmark - GDP per capita serves as a benchmark for assessing economic well-being and development between countries.
- Income Estimation - It estimates average income, reflecting the average wealth available to each person in the population.
- Comparison Tool - Analysts use GDP per capita to compare economic productivity and living standards worldwide.
Top 10 Countries by GDP
Gross Domestic Product (GDP) measures the economic performance of countries and indicates their market value of all final goods and services produced. The top 10 countries by GDP dominate global economic output, reflecting their industrial and technological strength.
- United States leads the global GDP rankings - It has the largest economy driven by diverse industries including technology, finance, and consumer goods.
- China holds the second position - Rapid industrial growth and export-oriented economy contribute to its substantial GDP.
- Japan ranks third globally - Strong manufacturing and technology sectors boost its economic output.
- Germany is Europe's largest economy - Known for engineering, automotive, and chemical industries supporting its GDP.
- India features prominently in the top ten - Its growing service sector and industrial expansion enhance its economic size.
- United Kingdom maintains a top GDP spot - Financial services and creative industries are key contributors.
- France holds a major economic position - Agriculture, manufacturing, and tourism drive its GDP.
- Italy is among the leading economies - Fashion, automotive, and machinery sectors are significant GDP sources.
- Canada ranks in the top ten GDP countries - Natural resources and energy exports underpin its economy.
- South Korea completes the top 10 list - Innovation in technology and manufacturing shapes its GDP strength.
GDP vs. GNP: Understanding the Difference
What distinguishes GDP from GNP in economic measurement? GDP, or Gross Domestic Product, calculates the total value of all goods and services produced within a country's borders. GNP, or Gross National Product, measures the total economic output produced by a country's residents, regardless of location.
Why is it important to differentiate between GDP and GNP? GDP focuses on domestic production and excludes incomes earned by residents abroad, while GNP includes those incomes but excludes foreign production within the country. This distinction helps in assessing economic health from different perspectives.
| Indicator | Definition |
|---|---|
| GDP | Value of goods and services produced within a country's borders |
| GNP | Total economic output produced by the country's residents worldwide |
| Focus | Geographical location of production |
| Includes | Income earned by foreign entities within the country |
| Excludes | Income earned by residents from abroad |
How do GDP and GNP influence economic policy? Policymakers use GDP to analyze domestic market strength and guide internal economic strategies. GNP offers insight into the income flow of residents globally and can highlight economic dependencies on foreign investments.
Which countries rely more on GDP versus GNP? Countries with significant foreign investment or many citizens working abroad may see GNP values diverging from GDP. Understanding both statistics aids in more accurate economic comparisons and policy formulations.
How GDP Impacts Everyday Life
Gross Domestic Product (GDP) measures the total economic output of a country, reflecting its overall economic health. Changes in GDP directly influence job opportunities, income levels, and public services.
- Employment Rates - Higher GDP growth often leads to increased job creation and lower unemployment rates.
- Income Levels - Rising GDP usually corresponds with higher average incomes and improved living standards.
- Public Services - Governments with stronger GDP can invest more in healthcare, education, and infrastructure.
Understanding GDP helps individuals grasp how economic trends affect their daily financial well-being and community resources.
Limitations of GDP as an Economic Indicator
Gross Domestic Product (GDP) measures the total value of goods and services produced in a country but fails to account for income inequality and environmental degradation. It overlooks non-market activities such as household labor and volunteer work, leading to an incomplete assessment of economic well-being. GDP also does not reflect the sustainability of growth, ignoring factors like resource depletion and long-term social welfare.