Infographics about trade visually present complex data, making global commerce trends easier to understand and analyze. They highlight key metrics such as export and import values, trade balances, and major trading partners, offering valuable insights at a glance. These visuals enhance decision-making by clearly illustrating the dynamics of international trade flows and economic impact.
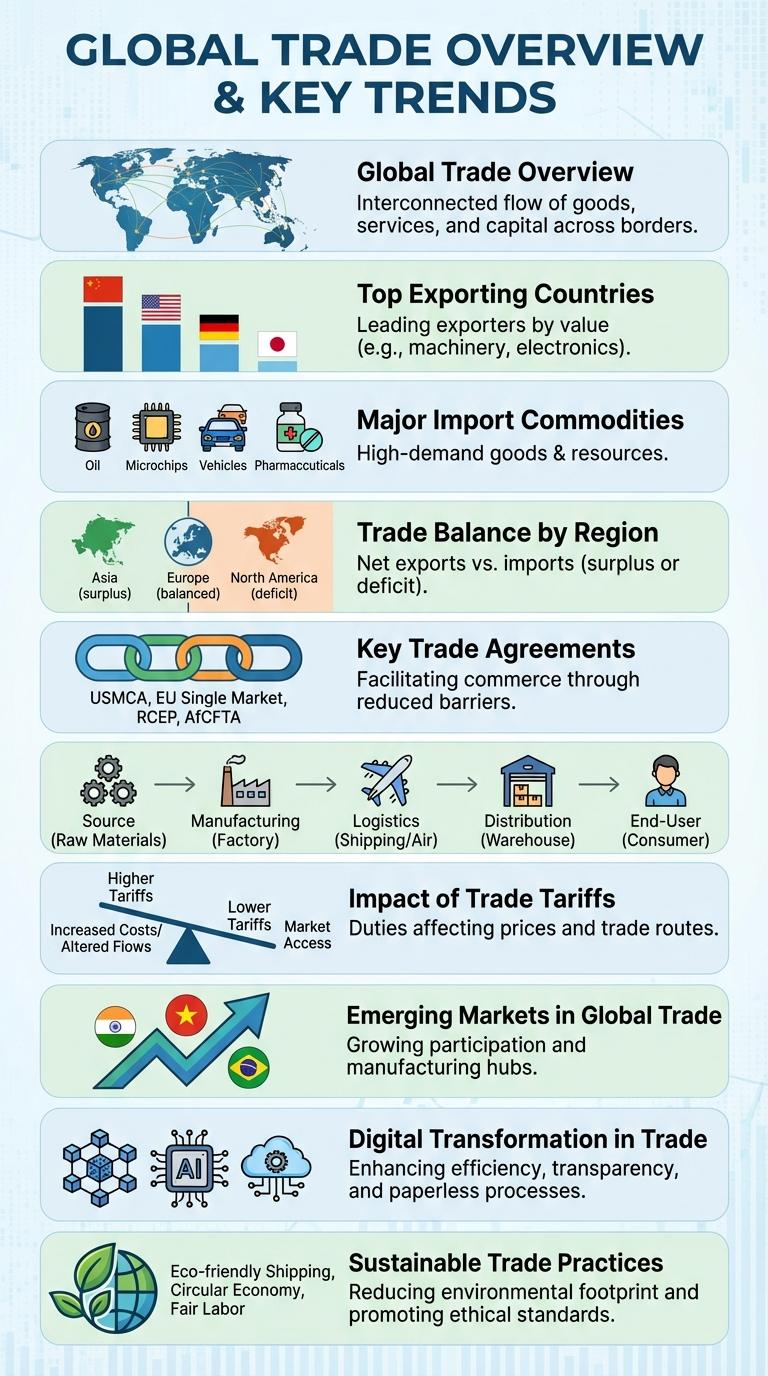
Global Trade Overview
Global trade involves the exchange of goods and services across international borders, driving economic growth and fostering international relationships. In 2023, the total value of global merchandise trade reached approximately $28 trillion, highlighting its critical role in the world economy.
Major trading regions include Asia-Pacific, Europe, and North America, with China, the United States, and Germany leading in export volumes. Trade agreements and technological advancements continue to shape trends, enhancing efficiency and market access worldwide.
Top Exporting Countries
Global trade plays a crucial role in the world economy, with certain countries leading in export volumes. Top exporting countries significantly influence international markets and supply chains.
China holds the position as the largest exporter, with a diverse range of manufactured goods. The United States follows, specializing in technology and agricultural products. Germany is known for high-quality machinery and vehicles, while Japan excels in electronics and automotive exports. South Korea focuses on semiconductors and shipbuilding industries.
Major Import Commodities
| Commodity | Global Import Value (USD Billion) |
|---|---|
| Electronics | 2,300 |
| Machinery | 1,900 |
| Vehicles | 1,200 |
| Pharmaceuticals | 800 |
| Crude Petroleum | 700 |
Trade Balance by Region
Trade balance reflects the difference between a region's exports and imports, indicating economic health and global competitiveness. Analyzing trade balances by region reveals key patterns in international trade flows and economic partnerships.
- Asia's Trade Surplus - Asia leads with a significant trade surplus due to strong exports in electronics, machinery, and textiles.
- Europe's Balanced Trade - Europe maintains a relatively balanced trade profile with competitive exports in automobiles and pharmaceuticals.
- North America's Trade Deficit - North America often experiences a trade deficit driven by high imports in energy, consumer goods, and technology sectors.
Key Trade Agreements
Trade agreements establish the rules and guidelines that govern international commerce between countries. They aim to reduce tariffs, enhance market access, and promote economic cooperation.
Key trade agreements include the North American Free Trade Agreement (NAFTA), now updated as the United States-Mexico-Canada Agreement (USMCA), the European Union's Single Market, and the Comprehensive and Progressive Agreement for Trans-Pacific Partnership (CPTPP). These agreements impact billions in trade, shaping global economic dynamics and fostering regional integration.
The Supply Chain Journey
The supply chain journey involves multiple stages from raw material sourcing to delivering finished products to customers. Efficient coordination between suppliers, manufacturers, and distributors ensures timely production and distribution. Tracking each step enhances transparency, reduces costs, and improves overall trade performance.
Impact of Trade Tariffs
Trade tariffs significantly influence international commerce by affecting prices and market access. Understanding their impact helps businesses and policymakers make informed decisions.
Tariffs increase the cost of imported goods, leading to higher prices for consumers.
- Reduced Import Volumes - Tariffs discourage imports by raising product costs, causing a decline in trade volumes.
- Domestic Industry Protection - Tariffs protect local producers from foreign competition by making imported goods less competitive.
- Retaliatory Measures - Countries often respond to tariffs with their own trade barriers, escalating trade tensions.
- Supply Chain Disruptions - Increased tariffs can disrupt global supply chains by altering sourcing strategies.
- Economic Growth Impact - Tariffs may slow economic growth by reducing trade efficiency and increasing production costs.
Emerging Markets in Global Trade
What role do emerging markets play in global trade? Emerging markets contribute significantly to the growth of global trade by offering new opportunities for investment and consumption. These markets are rapidly expanding, driven by rising incomes and industrialization.
| Emerging Market | Key Trade Characteristics |
|---|---|
| China | Largest exporter, major manufacturing hub |
| India | Growing IT and services sector, increasing exports |
| Brazil | Exporter of agricultural commodities and minerals |
| Indonesia | Strong export of palm oil and natural resources |
| South Africa | Main exporter of minerals and automotive products |
Digital Transformation in Trade
Digital transformation in trade revolutionizes how businesses operate by integrating advanced technologies such as artificial intelligence, blockchain, and IoT. These innovations enhance supply chain transparency, improve transaction speed, and reduce operational costs. As a result, global trade becomes more efficient, secure, and adaptive to market demands.