Disability encompasses a wide range of physical, mental, and sensory impairments that affect individuals' daily lives and participation in society. Infographics provide a clear and engaging way to present important statistics, challenges, and support resources related to disability. Visual representations help increase awareness and promote inclusivity by making complex information more accessible.
Understanding Disability: Key Definitions
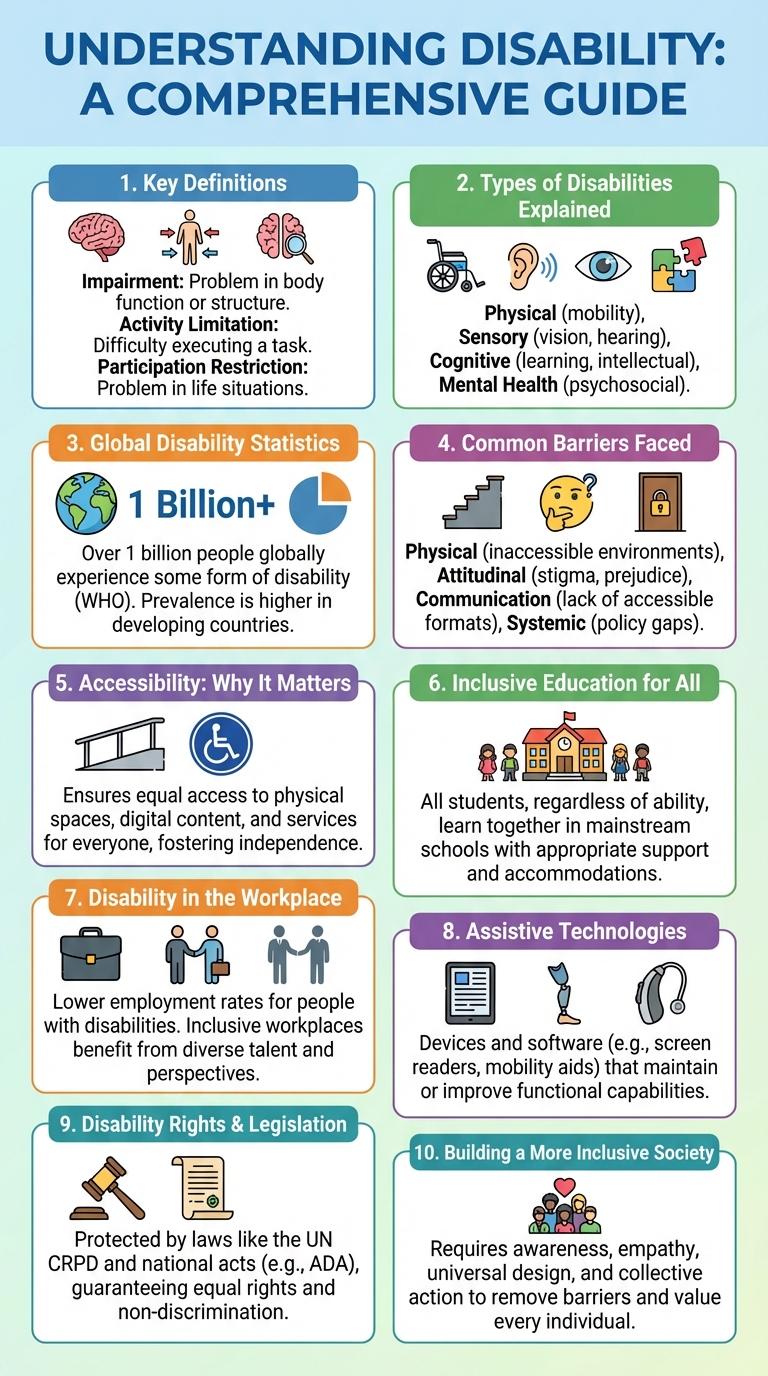
Disability encompasses physical, mental, intellectual, or sensory impairments that may limit a person's activities and participation in society. Understanding the various types of disabilities helps create inclusive environments and equal opportunities.
Key definitions include "impairment," which refers to any loss or abnormality of body structure or function, and "activity limitation," describing difficulties an individual may face when performing tasks. Social barriers often contribute more to disability than the impairment itself, highlighting the importance of accessibility and accommodation.
Types of Disabilities Explained
Disabilities encompass a wide range of physical, mental, and sensory impairments that affect daily living and activities. Common types include physical disabilities, intellectual disabilities, sensory disabilities, and mental health conditions. Understanding these categories promotes awareness and supports inclusive environments for everyone.
Global Disability Statistics
How prevalent is disability worldwide? Approximately 15% of the global population lives with some form of disability. This equates to over 1 billion people according to the World Health Organization.
Which regions have the highest rates of disability? Low-income and middle-income countries report higher prevalence due to factors like inadequate healthcare and increased risk of injury. Africa and South Asia have some of the highest disability rates globally.
What types of disabilities are most common globally? Mobility impairments, visual impairments, and hearing loss are among the top categories. Chronic health conditions also contribute significantly to disability numbers worldwide.
How does disability impact employment worldwide? People with disabilities face unemployment rates up to double those of non-disabled individuals. Barriers include inaccessible workplaces and discrimination.
What percentage of children experience disability globally? Approximately 5% of children worldwide have moderate to severe disabilities. Early intervention and inclusive education remain critical for their development.
Common Barriers Faced by People with Disabilities
People with disabilities often encounter multiple obstacles that limit their full participation in society. Understanding these common barriers is crucial to promoting accessibility and inclusion.
- Physical Barriers - Inaccessible buildings and transportation prevent easy mobility and access to essential services.
- Attitudinal Barriers - Negative stereotypes and discrimination create social exclusion and reduce opportunities.
- Communication Barriers - Lack of inclusive communication methods hinders effective interaction and information access.
Accessibility: Why It Matters
Accessibility ensures equal opportunities for people with disabilities, allowing them to participate fully in society. Removing barriers promotes independence and enhances quality of life.
Inclusive design benefits everyone by creating environments that accommodate diverse needs. Prioritizing accessibility fosters social inclusion and economic growth.
Inclusive Education for All
Inclusive education ensures that students with disabilities learn alongside their peers in supportive environments tailored to diverse needs. Schools implementing universal design principles and personalized learning plans promote equal access to quality education for all students. This approach fosters social integration, reduces stigma, and enhances academic outcomes for students with disabilities.
Disability in the Workplace: Facts & Figures
Disability in the workplace impacts millions, influencing diversity and inclusion efforts globally. Understanding key facts and figures helps employers create supportive environments.
- Employment Rate - Approximately 19% of working-age people with disabilities are employed, compared to 65% without disabilities.
- Accommodation Requests - 59% of employees with disabilities report needing workplace accommodations to perform their jobs effectively.
- Retention Benefits - Companies that provide accommodations experience an 80% retention rate of employees with disabilities.
Enhancing workplace accessibility improves productivity and fosters an inclusive company culture.
Assistive Technologies Empowering Lives
| Assistive Technology | Empowerment Benefit |
|---|---|
| Screen Readers | Enables visually impaired users to access digital content through audio output |
| Hearing Aids | Improves communication by amplifying sound for individuals with hearing loss |
| Wheelchairs | Provides mobility and independence for people with physical disabilities |
| Speech Recognition Software | Allows hands-free control and communication for individuals with motor impairments |
| Prosthetic Devices | Restores function and enhances quality of life for amputees |
Disability Rights and Legislation
Disability rights protect individuals from discrimination and ensure equal access to opportunities in education, employment, and public services. Key legislation supports these rights and promotes inclusion in society.
The Americans with Disabilities Act (ADA) prohibits discrimination based on disability in the United States, ensuring reasonable accommodations. The United Nations Convention on the Rights of Persons with Disabilities (CRPD) is an international treaty promoting the rights and dignity of persons with disabilities. National laws vary but consistently aim to remove barriers and foster accessibility.