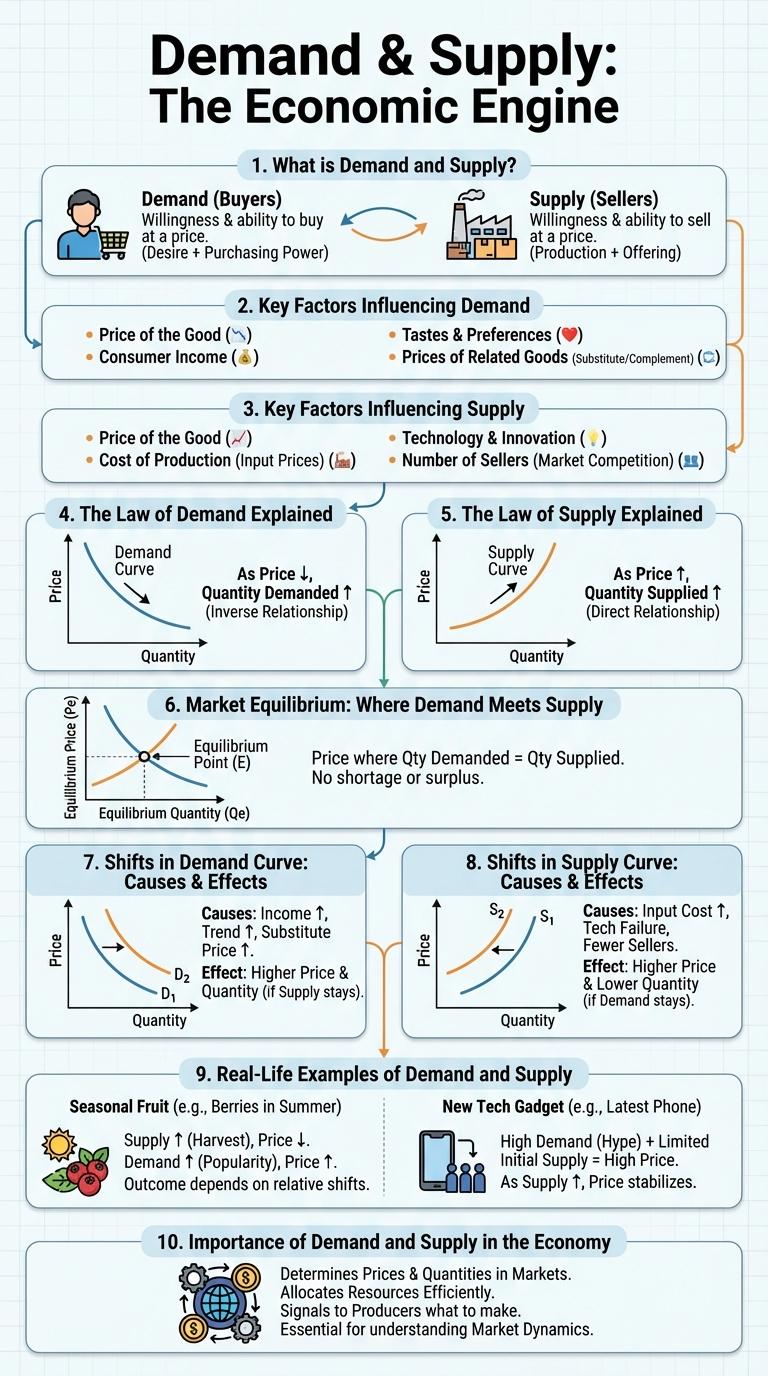
Understanding demand and supply is crucial for analyzing market behavior and price fluctuations. This infographic visually breaks down how consumer demand and producer supply interact to determine equilibrium prices and quantities. Key factors influencing shifts in demand and supply curves are highlighted to explain market dynamics clearly.
What is Demand and Supply?
Demand refers to the quantity of a product or service that consumers are willing and able to purchase at various prices. It reflects buyer behavior and preferences in a given market.
Supply represents the quantity of a product or service that producers are willing and able to offer for sale at different prices. It indicates seller willingness and resource availability within the economy.
Key Factors Influencing Demand
Demand is influenced by several critical factors including consumer income, preferences, and the prices of related goods. Changes in these elements can increase or decrease the quantity demanded of a product. Understanding these key factors helps businesses and policymakers predict market trends effectively.
Key Factors Influencing Supply
Supply in economics refers to the total amount of a specific good or service available to consumers. Several key factors influence the quantity of supply that producers are willing and able to offer at various prices.
- Production Costs - The expenses associated with manufacturing affect how much suppliers can produce profitably.
- Technology Advancements - Improved technology can increase production efficiency, raising supply levels.
- Number of Suppliers - More suppliers in the market generally lead to an increase in total supply.
The Law of Demand Explained
The Law of Demand describes the relationship between price and quantity demanded in a market. It explains how consumers adjust their purchasing behavior based on changes in price.
- Price and Quantity are Inversely Related - As prices decrease, the quantity demanded increases, and vice versa.
- Consumer Preference Affects Demand - Changes in tastes or preferences can shift demand independently of price.
- Substitution Effect - When prices rise, consumers may switch to alternative goods, reducing demand for the original product.
The Law of Demand is a fundamental principle in economics that helps predict consumer behavior and market trends.
The Law of Supply Explained
What is the Law of Supply? The Law of Supply states that as the price of a good or service increases, the quantity supplied increases as well. Suppliers are motivated to produce more when prices are higher, maximizing their profits.
How does the Law of Supply affect market behavior? When prices rise, producers supply more products to the market to take advantage of higher potential earnings. Conversely, if prices fall, suppliers reduce the quantity offered to avoid losses.
| Price | Quantity Supplied |
|---|---|
| Low | Small |
| Moderate | Medium |
| High | Large |
Market Equilibrium: Where Demand Meets Supply
| Concept | Description |
|---|---|
| Market Demand | Quantity of goods consumers are willing and able to purchase at various price levels over a specific time period. |
| Market Supply | Quantity of goods producers are willing and able to sell at different prices during the same time frame. |
| Market Equilibrium | The price point where quantity demanded equals quantity supplied; no shortage or surplus exists. |
| Equilibrium Price | The price at which the demand and supply curves intersect, balancing consumer desires and producer willingness. |
| Equilibrium Quantity | The exact number of units exchanged in the market when supply equals demand. |
Shifts in Demand Curve: Causes & Effects
Shifts in the demand curve occur when factors other than price change, such as consumer income, preferences, or the price of related goods. An increase in demand shifts the curve to the right, leading to higher equilibrium prices and quantities. A decrease in demand shifts the curve to the left, causing lower prices and reduced quantities sold.
Shifts in Supply Curve: Causes & Effects
The supply curve represents the relationship between the price of a good and the quantity supplied. Shifts in the supply curve occur when factors other than price influence the production capacity.
Causes of supply curve shifts include changes in production costs, technological advancements, and government policies such as taxes or subsidies. An increase in supply shifts the curve to the right, leading to a lower equilibrium price and higher quantity. Conversely, a decrease in supply shifts the curve to the left, causing a higher price and reduced quantity available in the market.
Real-Life Examples of Demand and Supply
Demand and supply are fundamental economic concepts that dictate the pricing and availability of goods and services. Real-life examples showcase how these forces interact in everyday markets.
For instance, during a heatwave, the demand for air conditioners surges, often leading to higher prices due to limited supply. Conversely, an increase in smartphone production can cause prices to drop as supply exceeds demand.