Infographics distill complex information into visually engaging formats that enhance comprehension and retention. They combine data, design, and storytelling to communicate messages clearly and efficiently. By transforming raw data into compelling visuals, infographics make information accessible to diverse audiences.
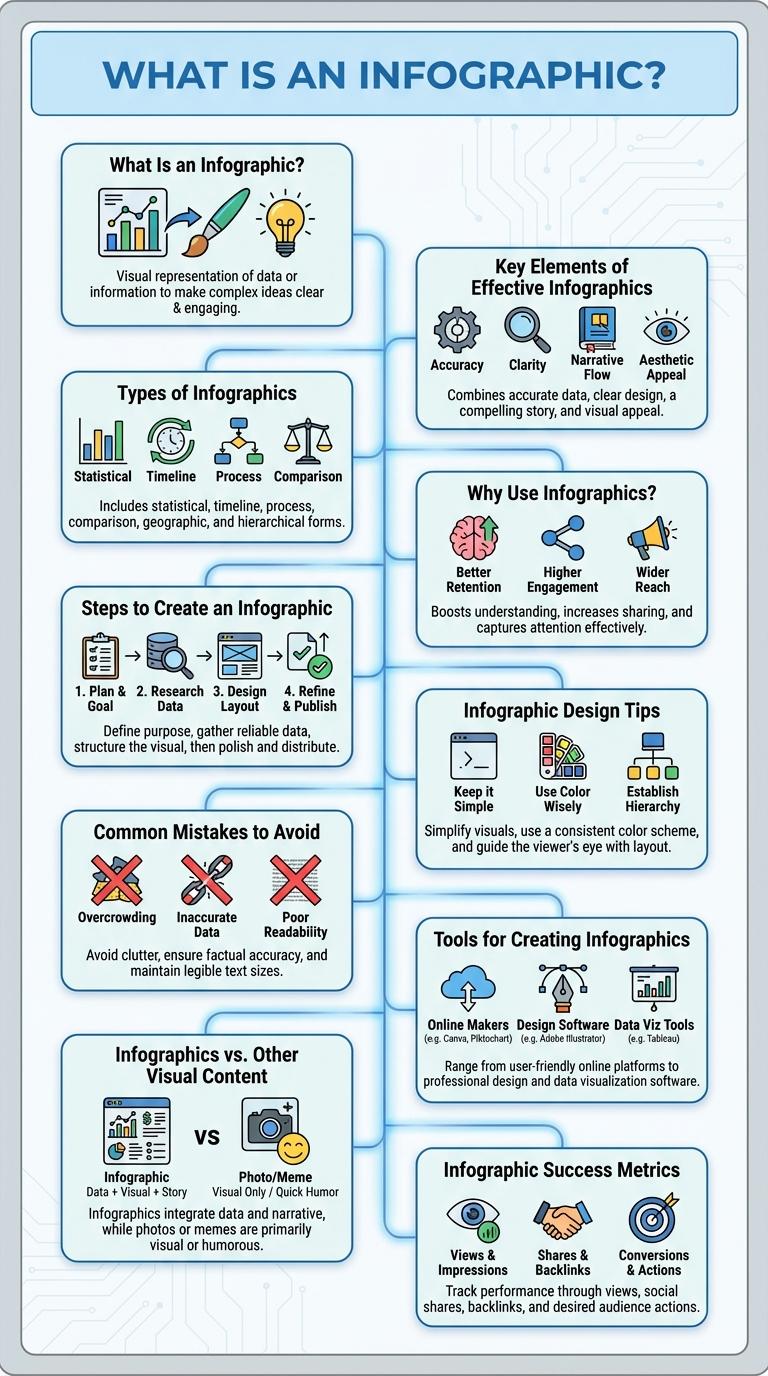
What Is an Infographic?
An infographic is a visual representation of information or data designed to make complex information easily understandable and engaging. It combines graphics, charts, and minimal text to convey messages quickly.
Infographics are used across various fields such as marketing, education, and journalism to simplify data presentation. They enhance retention by appealing to visual learners and breaking down information into digestible parts. Effective infographics balance aesthetics with clarity, ensuring the message is both attractive and informative.
Key Elements of Effective Infographics
What are the key elements of effective infographics? Effective infographics combine clear visuals with concise information to enhance understanding. They use data accuracy and engaging design to communicate messages quickly and memorably.
| Element | Description |
| Clarity | Simple and straightforward visuals prevent confusion. |
| Relevance | Information must be directly related to the topic presented. |
| Visual Hierarchy | Use of size, color, and placement guides viewers' attention. |
| Accuracy | Data and facts must be verified to build trust. |
| Engagement | Design elements keep the audience interested and focused. |
Types of Infographics
Infographics come in various types, each serving unique purposes to convey data effectively. Common types include statistical, informational, process, timeline, and geographic infographics. Choosing the right type enhances data comprehension and audience engagement.
Why Use Infographics?
Infographics combine visuals and data to simplify complex information, making it easier to understand and remember. They enhance engagement by presenting key points in a visually appealing format.
Using infographics increases information retention by up to 65%, compared to plain text. Marketers and educators rely on infographics to boost clarity, attract attention, and drive action effectively.
Steps to Create an Infographic
Creating an effective infographic involves clear planning, visual design, and data accuracy. Start by defining your target audience and key message to ensure clarity and relevance. Gather reliable data, choose a compelling design template, and use concise text and visuals for maximum impact.
Infographic Design Tips
| Infographic Design Tip | Description |
|---|---|
| Clarity | Use simple, clear visuals to convey information effectively without overwhelming the viewer. |
| Consistent Color Palette | Choose a harmonious color scheme to enhance readability and maintain visual cohesion. |
| Balanced Layout | Organize content logically with adequate white space to guide the viewer's eye through the data. |
| Readable Typography | Select fonts that are easy to read at various sizes, emphasizing key points through font weight and size. |
| Data Accuracy | Ensure all statistics and information sources are reliable and correctly represented within the design. |
Common Mistakes to Avoid
Infographics are powerful tools for visual communication but often include avoidable errors that reduce their effectiveness. Recognizing common mistakes helps create clear and engaging infographics.
- Overloading with Information - Presenting too much data overwhelms viewers and obscures the main message.
- Poor Color Choices - Using clashing or low-contrast colors makes the infographic hard to read and unappealing.
- Ignoring Data Accuracy - Displaying incorrect or outdated data damages credibility and misleads the audience.
- Lack of Clear Hierarchy - Without a visual structure, important information gets lost and confuses readers.
- Excessive Text - Crowding the design with long paragraphs reduces visual impact and discourages engagement.
Tools for Creating Infographics
Infographics are powerful visual tools for simplifying complex information and engaging audiences effectively. Several specialized tools enable users to create professional and eye-catching infographics with ease.
- Canva - A user-friendly platform offering customizable templates and drag-and-drop design features for quick infographic creation.
- Piktochart - Provides extensive data visualization options and integration with external data sources for detailed infographics.
- Venngage - Focuses on professional-grade templates and collaboration tools suitable for business infographic projects.
Infographics vs. Other Visual Content
Infographics combine data, visuals, and narrative to communicate complex information quickly and clearly. They are designed to enhance comprehension and retention compared to other visual content forms.
- Infographics vs. Charts - Infographics integrate multiple data points with icons and illustrations, while charts focus on single data relationships.
- Infographics vs. Photographs - Infographics convey abstract data visually, whereas photographs capture real-life moments or objects.
- Infographics vs. Videos - Infographics provide instant data visualization in a static format, while videos require time to absorb information sequentially.
Infographics excel at transforming complex data into accessible and engaging visuals, making them more effective for data storytelling than other visual content.