Economic issues impact global markets, influence government policies, and affect daily life for individuals and businesses. Understanding key indicators such as inflation, unemployment, and GDP growth enables more informed decision-making and strategic planning. Visualizing these data points through an infographic simplifies complex concepts, making economic trends accessible and actionable.
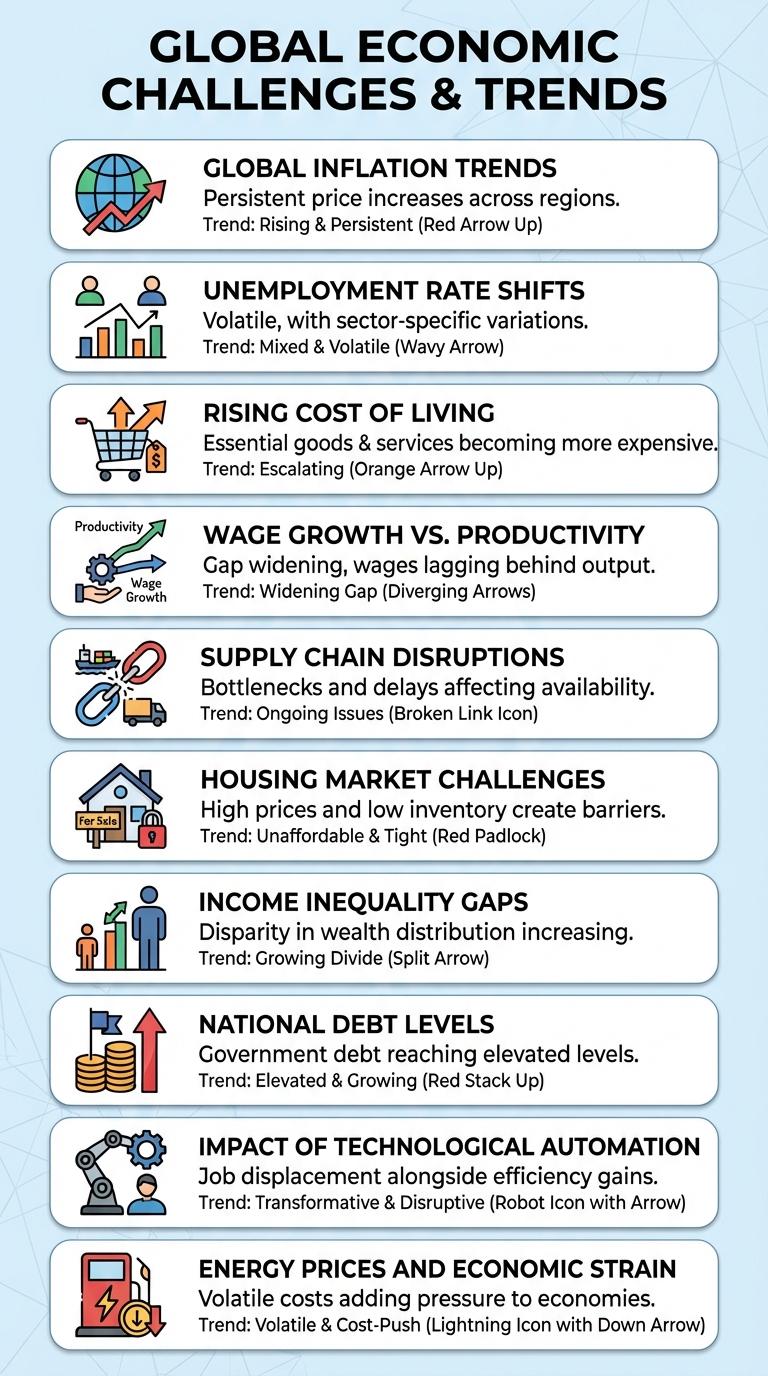
Global Inflation Trends
Global inflation rates have experienced significant fluctuations, with many countries facing double-digit increases in consumer prices. Key drivers include supply chain disruptions, rising energy costs, and geopolitical tensions impacting commodity markets. Central banks worldwide are implementing monetary policies aimed at stabilizing inflation while supporting economic growth.
Unemployment Rate Shifts
Unemployment rate shifts reflect changes in labor market conditions and economic health. Monitoring these shifts provides insight into job availability and worker participation trends.
- Rising Unemployment - Indicates economic downturns causing job losses and increased job-seeking activity.
- Falling Unemployment - Suggests economic growth and higher demand for labor, increasing employment opportunities.
- Long-term Unemployment - Highlights workers facing prolonged joblessness, impacting income stability and skills retention.
Tracking unemployment rate changes helps policymakers design targeted interventions to improve labor market outcomes.
Rising Cost of Living
The rising cost of living significantly impacts household budgets, as prices for essentials like food, housing, and energy continue to climb. Inflation rates have surged, reducing purchasing power and increasing financial strain on families worldwide. Economic policies and wage growth struggle to keep pace with these escalating expenses, leading to widespread economic challenges.
Wage Growth vs. Productivity
Wage growth and productivity are critical indicators of economic health. Over recent decades, productivity has increased significantly, while wage growth has lagged behind.
This disparity suggests that the gains from increased productivity are not being evenly distributed among workers. Productivity growth measures output per hour worked, often associated with technological advances. Wage growth reflects the increase in average earnings, which affects consumer spending and overall economic demand.
Supply Chain Disruptions
What are the main causes of supply chain disruptions? Supply chain disruptions result from factors like natural disasters, labor shortages, and geopolitical tensions. These issues cause delays and increase costs for businesses globally.
How do supply chain disruptions affect the global economy? Disruptions lead to product shortages and inflated prices, impacting consumer spending and corporate profits. The ripple effect slows economic growth and increases inflation rates worldwide.
Which industries face the most challenges due to supply chain disruptions? Manufacturing, automotive, and electronics sectors are highly vulnerable due to their reliance on timely component deliveries. Retail and food industries also experience significant delays and shortages.
What strategies help mitigate supply chain disruptions? Diversifying suppliers, increasing inventory buffers, and investing in supply chain visibility technologies reduce risks. Collaboration between partners and agile logistics systems enhance resilience against disruptions.
What role does technology play in managing supply chain issues? Technologies like AI, blockchain, and IoT improve tracking and forecasting accuracy. These tools enable quicker responses to disruptions, minimizing their economic impact.
Housing Market Challenges
The housing market faces significant challenges including soaring home prices and limited inventory. Many potential buyers struggle to find affordable options in competitive markets.
Rising interest rates further reduce home affordability, causing a slowdown in sales. Rent prices continue to increase, putting additional financial strain on renters and low-income households.
Income Inequality Gaps
| Economic Issue | Income Inequality Gaps |
|---|---|
| Definition | Disparity in income distribution among different population groups or individuals. |
| Key Metric | Gini Coefficient, ranges from 0 (perfect equality) to 1 (maximum inequality). |
| Global Trends | High-income countries show rising gaps; developing nations face widening disparities amidst rapid growth. |
| Contributing Factors | Technological change, globalization, education access, tax policies, labor market inequalities. |
| Social Impact | Reduced social mobility, increased poverty risk, heightened political instability, health inequalities. |
National Debt Levels
National debt levels represent the total amount of money a government owes to creditors, both domestic and international. High national debt can impact a country's economic stability and credit rating.
Countries with increasing debt levels may face challenges in funding public services and managing interest payments. Monitoring debt-to-GDP ratios helps assess a nation's ability to repay its obligations.
Impact of Technological Automation
Technological automation transforms labor markets by shifting job demands and skill requirements. Economic structures adapt as productivity increases and traditional roles evolve.
- Job Displacement - Automation replaces repetitive tasks, leading to reduced demand for low-skilled labor.
- Productivity Growth - Automated systems enhance output efficiency, driving economic growth across industries.
- Skill Shift - Increased emphasis on digital and technical skills creates new employment opportunities.