Visualizing crime statistics reveals patterns and trends that inform public safety strategies and policy decisions. Infographics simplify complex data, making it easier to comprehend crime rates, types, and hotspots at a glance. Clear, concise visuals enhance awareness and support community efforts to reduce criminal activity.
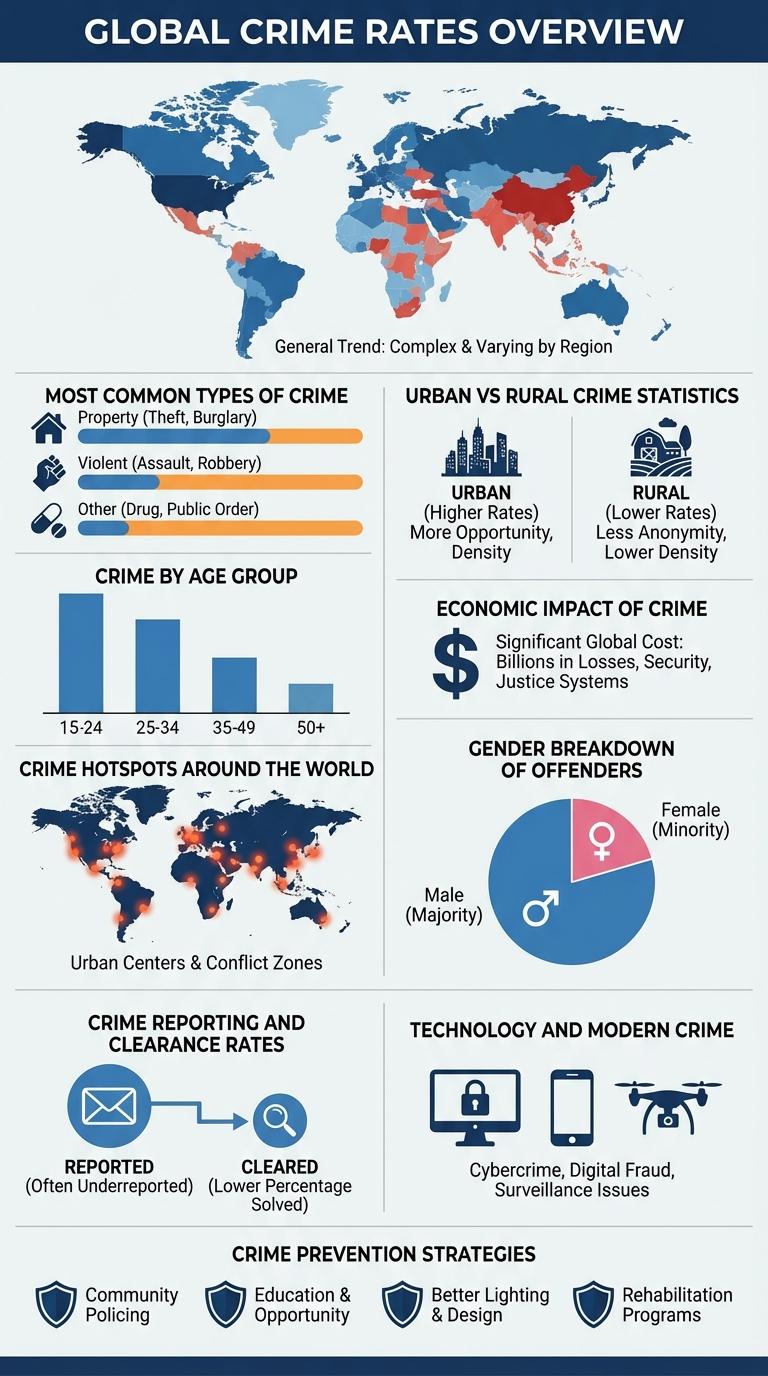
Global Crime Rates Overview
Global crime rates vary significantly across regions, with higher incidences observed in urban areas and developing countries. Property crimes such as theft and burglary dominate the statistics, while violent crimes show varying trends based on socio-economic factors. Accurate crime data collection remains essential for understanding patterns and developing effective prevention strategies worldwide.
Most Common Types of Crime
| Crime Type | Percentage of Total Crimes |
|---|---|
| Theft | 32% |
| Assault | 20% |
| Burglary | 15% |
| Robbery | 12% |
| Vandalism | 10% |
Crime by Age Group
Crime rates vary significantly across different age groups, with young adults typically showing higher involvement in criminal activities. Understanding this distribution helps in creating targeted crime prevention strategies and policies.
Statistics reveal that individuals aged 18 to 24 account for the highest percentage of arrests, followed by those aged 25 to 34. Crime rates generally decline as age increases, showing lower rates among older adults and seniors.
Crime Hotspots Around the World
Where are the most dangerous crime hotspots around the world? Crime rates vary significantly by region, with some urban areas experiencing higher incidences of violent crimes and thefts. Identifying these hotspots helps in focusing law enforcement and prevention efforts.
| City | Crime Type |
|---|---|
| Caracas, Venezuela | Homicide, Armed Robbery |
| San Pedro Sula, Honduras | Gang Violence, Kidnapping |
| Johannesburg, South Africa | Assault, Property Crime |
| Rio de Janeiro, Brazil | Drug Trafficking, Robbery |
| Chicago, USA | Gun Violence, Theft |
Urban vs Rural Crime Statistics
Urban areas experience higher rates of violent crimes such as assault and robbery compared to rural regions. Property crimes like burglary and theft show more variation, with some rural areas reporting surprisingly high incidences. Law enforcement resource allocation often reflects these differences, focusing more heavily on urban crime prevention strategies.
Economic Impact of Crime
Crime imposes significant economic burdens on societies, affecting both public resources and private assets. Understanding the economic impact is crucial for effective policy development and resource allocation.
- Cost of Property Crime - Property crimes result in billions of dollars in losses annually due to stolen goods, property damage, and increased insurance premiums.
- Law Enforcement Expenses - Governments allocate substantial funds to policing, criminal investigations, and judiciary processes to combat crime.
- Impact on Businesses - Crime leads to higher security costs, lost productivity, and reduced investor confidence for affected businesses.
Reducing crime rates can significantly enhance economic stability and promote growth in affected communities.
Gender Breakdown of Offenders
Understanding the gender breakdown of offenders is crucial in analyzing crime patterns and developing targeted prevention strategies. Males significantly outnumber females in most criminal activities, but the types of crimes committed often vary by gender.
- Male Offenders Predominate - Over 70% of offenders are male, representing a majority in violent and property crimes.
- Female Offenders Rising - Female involvement in certain crimes, such as drug-related offenses, has increased over the past decade.
- Different Crime Types by Gender - Males more frequently commit violent crimes, while females are more often linked to property and fraud-related offenses.
Crime Reporting and Clearance Rates
Crime reporting and clearance rates are critical metrics in understanding law enforcement effectiveness. Higher reporting rates often lead to increased opportunities for resolving cases.
Clearance rates indicate the percentage of reported crimes that are "cleared" through arrest or other means. Violent crimes generally have higher clearance rates compared to property crimes. Improved community trust and communication between police and citizens enhance both reporting and clearance outcomes.
Technology and Modern Crime
Technology plays a critical role in both enabling and combating modern crime. Cybercrime is evolving rapidly, challenging law enforcement agencies worldwide.
- Rise of Cybercrime - Cyberattacks such as phishing, ransomware, and data breaches have surged, targeting individuals and corporations.
- Use of Artificial Intelligence - Criminals exploit AI to automate hacking, create deepfakes, and manipulate online information.
- Advanced Forensic Technologies - Law enforcement uses digital forensics, AI analytics, and biometrics to solve complex crimes efficiently.