Visualizing population data through an infographic reveals key demographic trends and patterns clearly and efficiently. It highlights age distribution, density, and growth rates across regions, making complex statistics accessible at a glance. This approach aids policymakers and researchers in understanding population dynamics for better planning and resource allocation.
Global Population Growth Trends
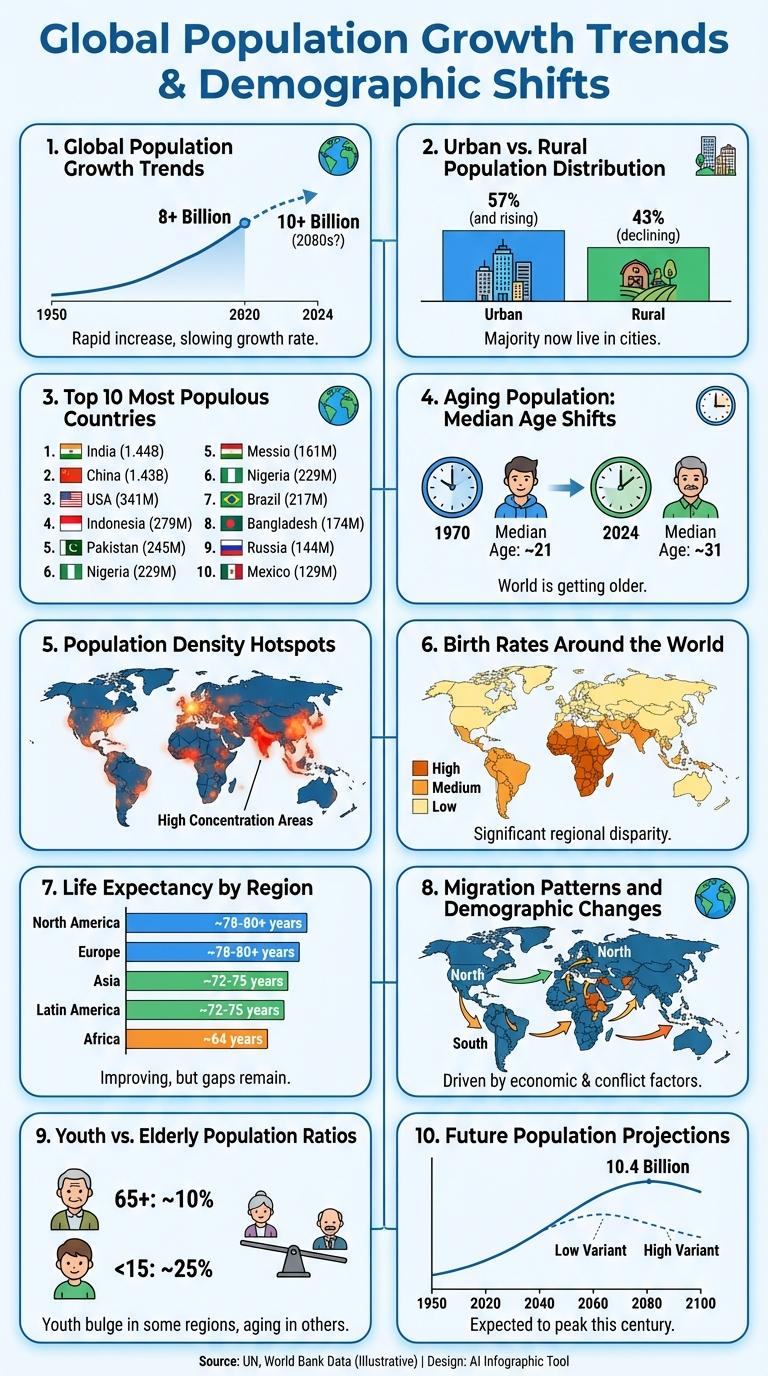
Global population growth has accelerated significantly over the past century, reaching nearly 8 billion people as of 2024. This surge is primarily driven by higher birth rates in developing regions and improvements in healthcare worldwide.
Urbanization continues to rise, with more than 55% of the global population now living in cities. Population growth rates are slowing in many high-income countries due to lower fertility rates. Africa and Asia remain the fastest-growing continents, accounting for the majority of future population increases.
Urban vs. Rural Population Distribution
The global population is increasingly shifting towards urban areas, with over 56% of people living in cities as of 2023. Urbanization drives economic growth but also presents challenges for infrastructure and resources.
Rural populations, while smaller, remain vital for agriculture and cultural heritage, accounting for roughly 44% of the world's inhabitants. Population density in rural areas tends to be lower, impacting access to services and development opportunities.
Top 10 Most Populous Countries
The world's population is concentrated in a few key countries, with the top 10 most populous nations accounting for over half of the global total. Understanding population distribution helps in analyzing economic, social, and environmental impacts worldwide.
- China leads as the most populous country - China has over 1.4 billion people, making it the largest single nation by population.
- India is close behind - India's population exceeds 1.4 billion and is projected to surpass China soon.
- United States ranks third - The US has a population of approximately 334 million people, reflecting significant diversity.
- Indonesia holds the fourth spot - With around 277 million residents, it is the largest population in Southeast Asia.
- Brazil is the most populous in South America - Brazil's population of about 216 million drives its regional influence.
Aging Population: Median Age Shifts
| Year | Median Age (Global) |
|---|---|
| 2000 | 28.6 years |
| 2010 | 30.2 years |
| 2020 | 31.8 years |
| 2030 (Projected) | 35.0 years |
| 2050 (Projected) | 38.5 years |
The global median age is rising due to lower birth rates and increased life expectancy. Aging populations impact economic growth, healthcare demand, and social services worldwide. Regions such as Europe, Japan, and North America show higher median ages, while developing regions have younger populations but are also experiencing gradual aging trends.
Population Density Hotspots
Population density hotspots are regions with exceptionally high numbers of people living per square kilometer. These areas often face unique challenges related to urban planning, resources, and infrastructure.
Studying population density hotspots helps policymakers address overcrowding and improve living conditions.
- South Asia - Home to several of the world's most densely populated regions, including parts of India and Bangladesh with density exceeding 1,000 people per square kilometer.
- East Asia - Urban centers like Tokyo, Seoul, and Shanghai exhibit extremely high population densities, supporting millions in compact areas.
- Europe - Western European metropolitan areas, such as London and Paris, contain dense populations concentrated within limited land space.
Birth Rates Around the World
Global birth rates vary significantly, with the highest rates observed in Sub-Saharan Africa, such as Niger, where the birth rate exceeds 40 births per 1,000 people annually. Contrastingly, countries in Europe and East Asia, including Japan and Germany, report birth rates below 10 births per 1,000 people, reflecting aging populations and lower fertility rates. These disparities impact economic development, healthcare systems, and social policies worldwide.
Life Expectancy by Region
Life expectancy varies significantly across different global regions, reflecting disparities in healthcare, nutrition, and living conditions. Understanding these variations helps identify areas needing targeted health interventions.
- High Life Expectancy in Developed Regions - North America and Europe typically have life expectancies exceeding 78 years due to advanced medical facilities and healthier lifestyles.
- Moderate Life Expectancy in Asia and Latin America - These regions show life expectancies ranging from 70 to 77 years, influenced by improving healthcare systems and economic growth.
- Lower Life Expectancy in Sub-Saharan Africa - Life expectancy often falls below 65 years due to challenges such as infectious diseases and limited access to medical resources.
Global efforts focus on reducing these disparities to ensure longer and healthier lives worldwide.
Migration Patterns and Demographic Changes
Migration patterns significantly influence global demographic changes, reshaping population structures in many regions. Urban areas often experience rapid growth due to internal migration from rural zones.
International migration impacts both source and destination countries, altering age distributions and workforce composition. These shifts affect economic development, social services, and cultural dynamics worldwide.
Youth vs. Elderly Population Ratios
The infographic highlights the ratio between youth and elderly populations, emphasizing demographic trends worldwide. Younger populations dominate in developing regions, while aging populations are more prevalent in developed countries. Understanding these ratios assists policymakers in addressing social services and economic planning effectively.