Excel infographics visually simplify complex data by combining charts, graphs, and icons to enhance understanding. They highlight key Excel features such as formulas, pivot tables, and data visualization tools, making it easier to grasp essential functions. Clear and concise design transforms spreadsheet information into engaging, digestible insights.
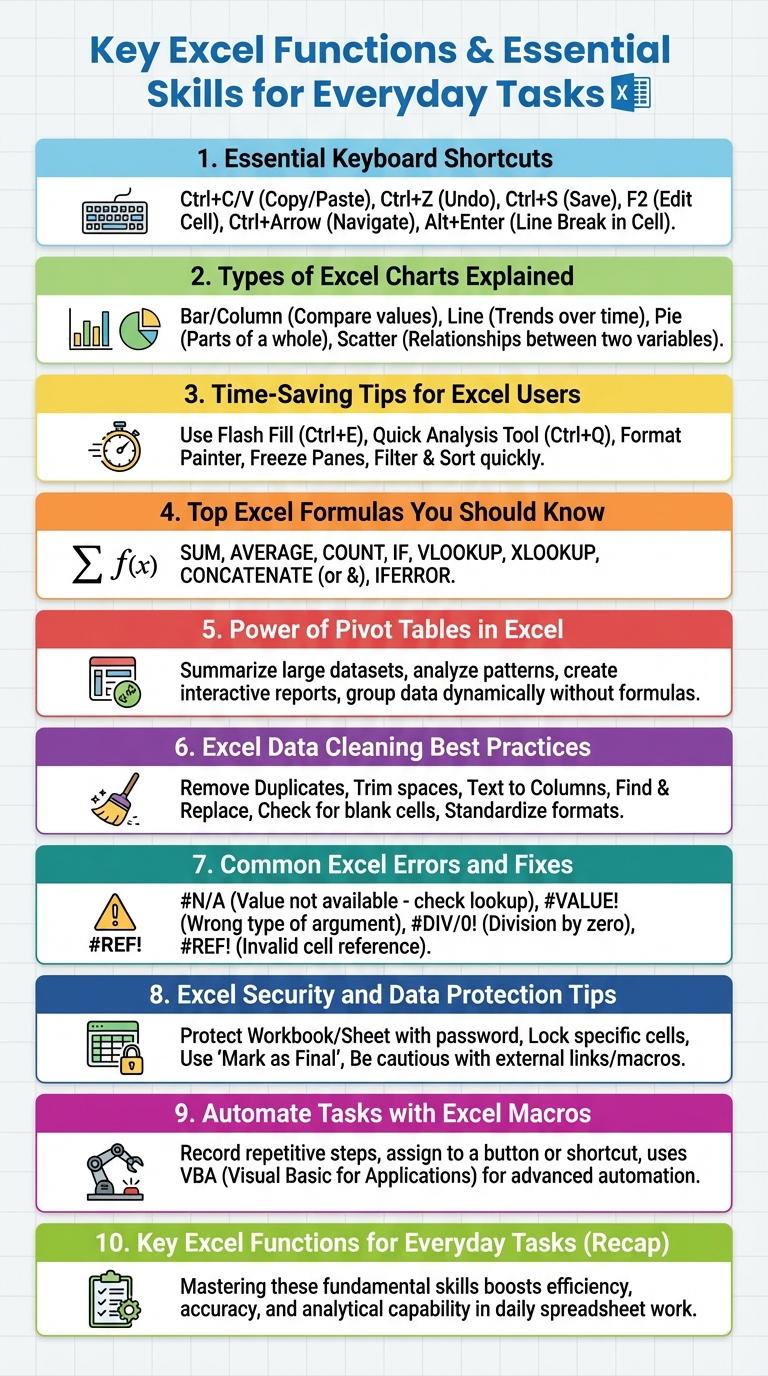
Key Excel Functions for Everyday Tasks
Excel offers a variety of functions that simplify everyday tasks such as data analysis, budgeting, and scheduling. Key functions include SUM for adding values, IF for logical comparisons, and VLOOKUP for searching data tables. Mastering these functions enhances productivity and accuracy in managing numerical and textual data.
Essential Keyboard Shortcuts in Excel
Excel keyboard shortcuts boost productivity and enhance data management efficiency. Mastering essential shortcuts streamlines navigation and editing processes.
- Ctrl + C (Copy) - Copies the selected cells or text to the clipboard for duplication.
- Ctrl + V (Paste) - Inserts the clipboard content into the selected cell or range.
- Ctrl + Z (Undo) - Reverses the last action, helping correct mistakes quickly.
- Ctrl + Arrow Keys (Navigate) - Moves the cursor to the edge of data regions swiftly for faster navigation.
- Ctrl + Shift + L (Toggle Filters) - Activates or deactivates filters in the selected data range for easy sorting and filtering.
Types of Excel Charts Explained
Excel offers a variety of chart types to visually represent data for better analysis and decision-making. Understanding the different chart types helps users select the most effective visualization for their specific dataset.
- Column Chart - Displays data as vertical bars, ideal for comparing discrete categories over time.
- Line Chart - Shows trends and changes across continuous data points, perfect for time-series analysis.
- Pie Chart - Illustrates proportions of a whole with segmented slices, useful for percentage distributions.
- Bar Chart - Uses horizontal bars to compare values across categories, suitable for long category names.
- Scatter Chart - Plots individual data points to reveal correlations or patterns between variables.
Time-Saving Tips for Excel Users
Microsoft Excel is a powerful tool widely used for data analysis, budgeting, and project management. Mastering time-saving tips can significantly enhance productivity and efficiency when working with spreadsheets.
Utilize keyboard shortcuts like Ctrl+C for copy and Ctrl+V for paste to speed up routine tasks. Use the Flash Fill feature to automatically complete data patterns without manual entry. Leverage Excel's built-in formulas and functions such as SUM, VLOOKUP, and IF to automate calculations and data manipulation.
Top Excel Formulas You Should Know
| Excel Formula | Purpose |
|---|---|
| =SUM(range) | Adds all numbers in a range of cells |
| =VLOOKUP(lookup_value, table_array, col_index, FALSE) | Searches for a value in the first column and returns a value in the same row |
| =IF(logical_test, value_if_true, value_if_false) | Performs conditional logic to return different results |
| =CONCATENATE(text1, text2, ...) | Joins two or more text strings into one string |
| =INDEX(array, row_num, [column_num]) | Returns the value of a cell in a table based on row and column numbers |
Power of Pivot Tables in Excel
Pivot Tables in Excel empower users to quickly summarize and analyze large datasets, transforming raw data into meaningful insights. They allow dynamic data manipulation without altering the original dataset.
With Pivot Tables, users can easily group, filter, and sort data, enabling efficient trend spotting and decision-making. This feature supports various calculations like sums, averages, and counts, enhancing reporting capabilities.
Excel Data Cleaning Best Practices
Excel data cleaning ensures accuracy and reliability in data analysis by removing errors, duplicates, and inconsistencies. Proper data cleaning improves decision-making and optimizes spreadsheet performance.
Best practices include using Excel functions like TRIM, CLEAN, and REMOVE DUPLICATES to standardize data. Implement validation rules and conditional formatting to maintain data integrity and quickly identify anomalies.
Common Excel Errors and Fixes
Common Excel errors include #DIV/0!, #VALUE!, #REF!, #NAME?, and #NUM!. Each error arises from specific issues such as division by zero, incorrect data types, invalid cell references, unrecognized functions, and invalid numeric values. Fixes involve checking formulas for accuracy, ensuring proper data inputs, and using error-handling functions like IFERROR to manage unexpected results.
Excel Security and Data Protection Tips
Excel is a powerful tool for data analysis, making security and data protection essential for maintaining sensitive information. Proper measures help prevent unauthorized access and data loss in Excel workbooks.
- Use Strong Passwords - Protect your Excel files with complex passwords to restrict unauthorized access.
- Enable File Encryption - Encrypt Excel workbooks to safeguard data during storage and transmission.
- Regularly Backup Files - Keep consistent backups to avoid permanent data loss in case of corruption or accidental deletion.
Implementing these Excel security practices ensures the integrity and confidentiality of your data.