An earthquake drawing infographic visually represents seismic activity and tectonic movements through clear, engaging illustrations. This infographic simplifies complex geological processes, making it easier to understand how earthquakes occur and their impact on the Earth's surface. It highlights key concepts such as fault lines, seismic waves, and earthquake magnitude with informative visuals and concise explanations.
Understanding Earthquakes: Key Facts
Earthquakes occur when tectonic plates shift, releasing energy that causes the ground to shake. Seismographs measure this energy, helping scientists determine the earthquake's magnitude and location. Understanding these key facts improves preparedness and can save lives during seismic events.
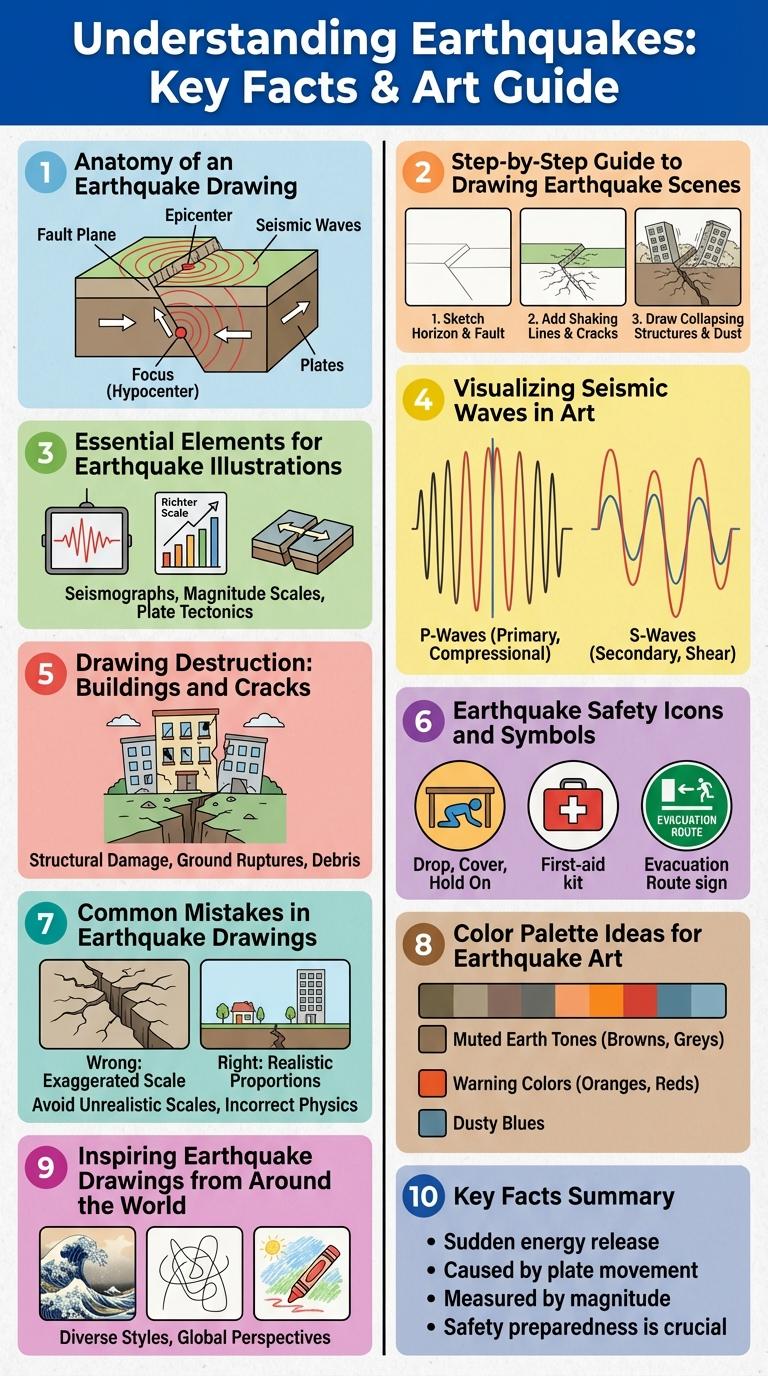
Anatomy of an Earthquake Drawing
An earthquake drawing visually represents the geological processes and structures involved during an earthquake. It highlights key elements such as tectonic plates, fault lines, and the epicenter.
The anatomy of an earthquake drawing typically includes the focus, which is the point beneath the earth's surface where the earthquake originates. The epicenter is directly above the focus on the surface, often marked with a symbol or dot. Fault lines indicate the fractures along which the earth's crust has shifted, illustrating the direction and movement of the tectonic plates.
Step-by-Step Guide to Drawing Earthquake Scenes
Creating an earthquake scene drawing involves illustrating dynamic movement and structural impact effectively. This guide breaks down the process into clear, manageable steps for artists.
- Sketch the Horizon and Buildings - Begin by drawing a straight horizon line with simple building shapes to establish the setting.
- Add Cracks and Debris - Illustrate cracks in the ground and walls, plus scattered debris to portray destruction from the quake.
- Incorporate Vibrating Effects - Use wavy or jagged lines around structures to simulate shaking and motion caused by the earthquake.
Essential Elements for Earthquake Illustrations
Creating effective earthquake illustrations requires clarity and accuracy to convey complex geological processes. Essential elements highlight key concepts for educational and emergency preparedness materials.
- Fault Lines - Accurately drawn fault lines represent the zones where tectonic plates meet and earthquakes originate.
- Seismic Waves - Visual depiction of seismic waves illustrates how energy propagates from the earthquake's epicenter.
- Epicenter and Hypocenter - Clear marking of the epicenter and hypocenter shows the earthquake's surface location and its underground origin point.
Visualizing Seismic Waves in Art
Infographics about earthquakes often use artistic drawings to visualize seismic waves, making complex scientific phenomena more accessible. These visuals depict wave propagation, including primary (P) and secondary (S) waves, showcasing the energy released during an earthquake.
Artistic interpretations highlight wave patterns, amplitude, and frequency to enhance understanding of earthquake mechanics. Through color coding and dynamic shapes, these drawings provide educational insights into how seismic waves travel through Earth's layers.
Drawing Destruction: Buildings and Cracks
Earthquake drawings vividly illustrate the intense destruction caused by seismic activity, focusing on damaged buildings and visible cracks. These infographics help in understanding structural vulnerabilities and the impact of ground shaking on urban areas.
Buildings are depicted with collapsed walls, tilted frames, and shattered windows, highlighting the extreme forces involved. Cracks on the ground and walls reveal fault lines and stress points, emphasizing the severity of the earthquake's impact on infrastructure.
Earthquake Safety Icons and Symbols
| Icon/Symbol | Description |
|---|---|
| Seismic Waves | Graphic representation of primary (P) and secondary (S) waves indicating earthquake propagation. |
| Drop, Cover, and Hold | Illustration of a person dropping to the ground, taking cover under furniture, and holding on to protect against falling debris. |
| Emergency Kit | Icon showing essential supplies like water, flashlight, and first aid for earthquake preparedness. |
| Safe Zones | Marked safe spots inside buildings, such as under sturdy tables or door frames, depicted for immediate refuge. |
| Evacuation Route | Directional arrows guiding people to designated emergency exits and assembly points after shaking stops. |
Common Mistakes in Earthquake Drawings
Creating accurate earthquake drawings is crucial for understanding seismic events. Common mistakes can mislead interpretations and affect disaster preparedness.
- Inaccurate Fault Lines - Fault lines are often drawn without considering recent geological surveys, leading to incorrect seismic risk zones.
- Scale Misrepresentation - Earthquake magnitude and affected areas are sometimes depicted without proper scaling, distorting the event's impact.
- Ignoring Aftershocks - Many earthquake drawings omit aftershocks, which are essential for a complete understanding of seismic activity.
Correcting these errors enhances the reliability of earthquake visualizations and supports better safety measures.
Color Palette Ideas for Earthquake Art
Earthquake art often uses a dynamic color palette to capture the intensity and movement of seismic activity. Vibrant reds and oranges symbolize energy and destruction, while blues and grays represent stability and calmness. Earth tones like browns and greens can add a natural element, reflecting the earth's surface affected by the quake.