Algebra transforms abstract concepts into visual understanding through infographics that break down complex equations and variables into manageable parts. Such infographics highlight key principles, from solving for unknowns to manipulating expressions, making learning more accessible and engaging. By combining visuals with concise explanations, they enhance comprehension and retention of algebraic fundamentals.
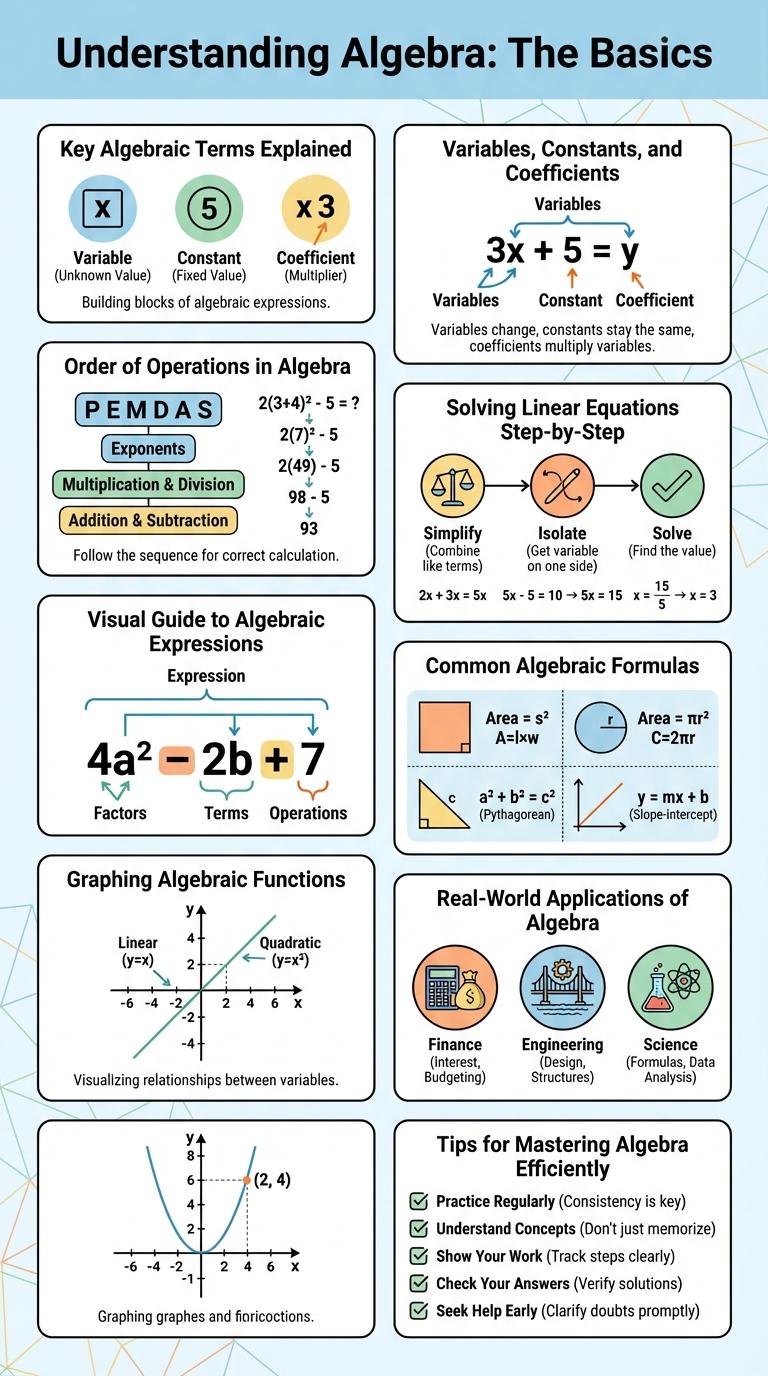
Understanding Algebra: The Basics
Algebra is a branch of mathematics that uses symbols and letters to represent numbers and quantities. It helps solve equations and understand relationships between variables.
Key concepts include variables, constants, coefficients, and expressions. Mastering these basics is essential for progressing in higher-level math and real-world problem solving.
Key Algebraic Terms Explained
Algebra is a branch of mathematics dealing with symbols and the rules for manipulating these symbols. Key algebraic terms include variables, constants, coefficients, and expressions. Understanding these fundamental concepts is essential for solving equations and inequalities.
Variables, Constants, and Coefficients
An infographic about algebra highlights the essential components: variables, constants, and coefficients. Variables are symbols representing unknown values, while constants are fixed numbers that do not change. Coefficients are numerical factors multiplying the variables, defining their impact in an expression or equation.
Order of Operations in Algebra
Understanding the order of operations is essential for solving algebraic expressions correctly. This sequence ensures consistent and accurate results in mathematical calculations.
- Parentheses (P) - Perform calculations inside parentheses or brackets first to simplify expressions.
- Exponents (E) - Evaluate exponents and powers after parentheses to handle powers and roots.
- Multiplication and Division (MD) - Process multiplication and division from left to right as they appear in the expression.
- Addition and Subtraction (AS) - Complete addition and subtraction last, following the left-to-right order.
- PEMDAS Rule - The acronym PEMDAS guides the order: Parentheses, Exponents, Multiplication, Division, Addition, Subtraction.
Solving Linear Equations Step-by-Step
Solving linear equations is a fundamental skill in algebra that helps find the value of unknown variables. This infographic breaks down the process into clear, manageable steps for better understanding.
- Identify the equation - Recognize the linear equation in the form ax + b = c.
- Isolate the variable - Use inverse operations to get the variable alone on one side of the equation.
- Simplify both sides - Combine like terms and simplify constants on each side.
- Solve for the variable - Perform the necessary arithmetic to find the value of the unknown.
- Verify the solution - Substitute the value back into the original equation to check correctness.
Following these steps ensures accuracy and builds a strong foundation in solving linear equations effectively.
Visual Guide to Algebraic Expressions
| Element | Description |
|---|---|
| Variable | Symbol representing unknown values, commonly x, y, or z |
| Coefficient | Numeric factor multiplying the variable in an expression |
| Constant | Fixed numeric value without variables |
| Term | Single part of an expression, such as 3x or 7 |
| Expression | Combination of terms added, subtracted, or multiplied |
Common Algebraic Formulas
Algebra involves the manipulation of symbols and expressions to solve equations and understand relationships. Knowing common algebraic formulas simplifies complex calculations and enhances problem-solving skills.
- Quadratic Formula - Solves quadratic equations of the form ax2 + bx + c = 0, given by x = (-b +- (b2 - 4ac)) / 2a.
- Difference of Squares - Expresses a2 - b2 as (a - b)(a + b), useful for factoring expressions efficiently.
- Binomial Expansion - Expands (a + b)2 into a2 + 2ab + b2, a fundamental identity for polynomial expressions.
Graphing Algebraic Functions
What is graphing algebraic functions? Graphing algebraic functions involves plotting equations on a coordinate plane to visualize relationships between variables. This technique helps in understanding the behavior and characteristics of functions such as linear, quadratic, and cubic.
How do you graph linear functions? Linear functions create straight lines and have the general form y = mx + b, where m is the slope and b is the y-intercept. Plotting points using these values allows you to draw the exact line representing the function.
What distinguishes quadratic function graphs? Quadratic functions form parabolas and follow the formula y = ax2 + bx + c. The graph opens upward or downward depending on the value of a, and the vertex represents the function's maximum or minimum point.
Which key features are essential in graphing? Important features to consider include intercepts, slope or rate of change, vertex for parabolas, and axis of symmetry. Identifying these aids in accurate graph plotting and function analysis.
Why is graphing algebraic functions important? Graphing provides a visual interpretation of equations, making complex algebraic relationships easier to comprehend. It supports problem-solving and helps predict values within various mathematical and real-world applications.
Real-World Applications of Algebra
Algebra plays a crucial role in solving real-world problems across various fields such as engineering, finance, and technology. It enables individuals to model situations, analyze data, and make informed decisions using variables and equations.
In construction, algebra helps calculate dimensions and material costs, ensuring accuracy and efficiency. In finance, it assists in predicting investment growth through equations that represent interest rates and timelines.