Quantitative data visualization transforms complex numbers into clear, engaging graphics that enhance comprehension and decision-making. Infographics effectively highlight key statistics, trends, and comparisons by presenting numerical information visually. This approach simplifies data interpretation, making quantitative insights accessible to diverse audiences.
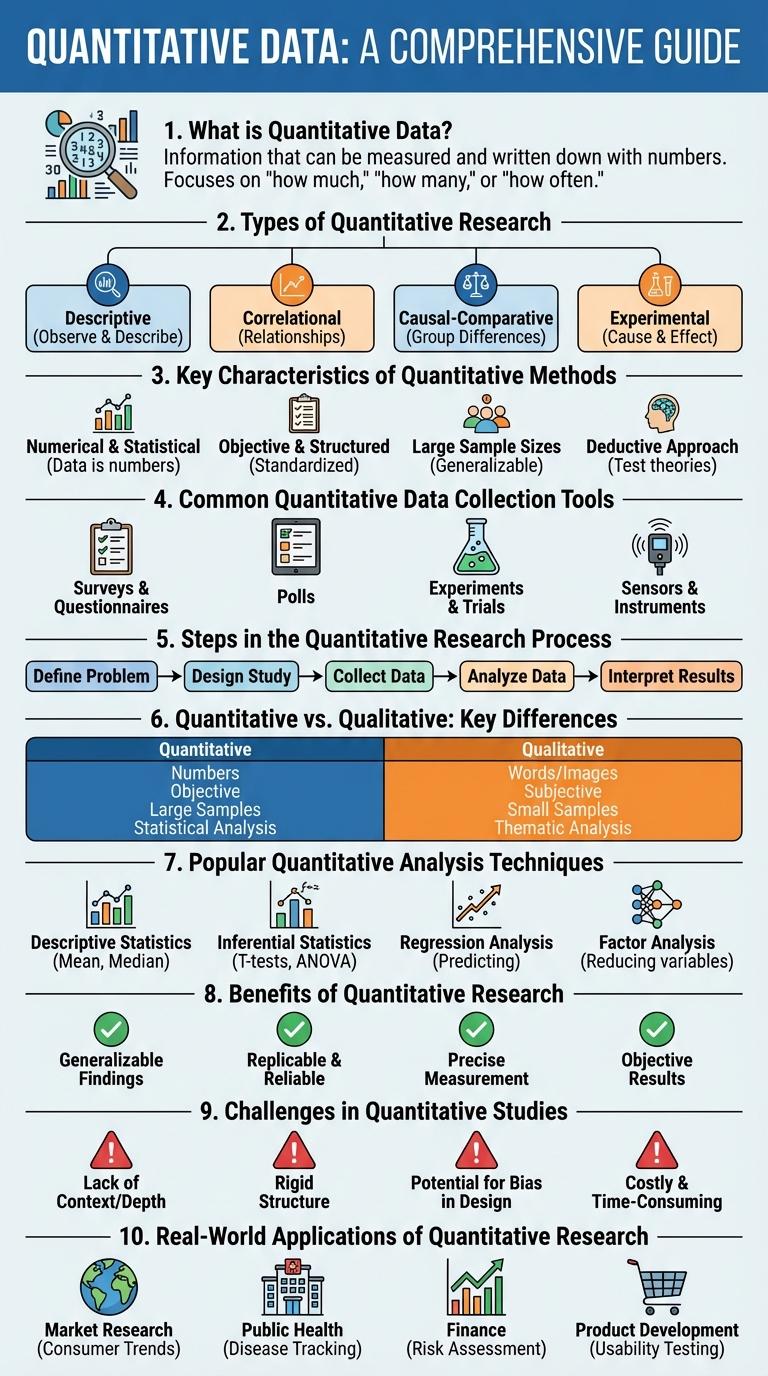
What is Quantitative Data?
| What is Quantitative Data? | Quantitative data refers to numerical information that can be measured and quantified. It is used to represent quantities and values, enabling statistical analysis and mathematical computations. |
|---|---|
| Types of Quantitative Data | Discrete data (countable values), Continuous data (measurable values) |
| Examples | Height, weight, age, temperature, sales figures |
| Purpose | To analyze trends, compare groups, perform statistical testing, and support decision making |
| Key Characteristics | Numerical form, objective measurement, scalable, can be visualized using charts and graphs |
Types of Quantitative Research
Quantitative research involves the systematic investigation of phenomena via statistical, mathematical, or computational techniques. It seeks to quantify data and generalize results from a larger sample population.
- Descriptive Research - Focuses on identifying and describing characteristics of a population or phenomenon through numerical data.
- Experimental Research - Examines cause-and-effect relationships by manipulating variables in controlled settings.
- Correlational Research - Investigates the statistical relationships between two or more variables without implying causation.
Key Characteristics of Quantitative Methods
Quantitative methods involve the systematic empirical investigation of observable phenomena via statistical, mathematical, or computational techniques. These methods emphasize numerical data collection, objective measurement, and the use of structured tools like surveys and experiments. Quantitative research aims to quantify variables and identify patterns, relationships, or causal effects through data analysis.
Common Quantitative Data Collection Tools
Quantitative data collection involves gathering numerical information to analyze patterns and trends. This method relies on structured tools designed to produce measurable and comparable data.
- Surveys - Structured questionnaires used to collect standardized responses from a large group.
- Experiments - Controlled studies measuring variables to determine cause-and-effect relationships.
- Observations - Systematic recording of numerical data through direct monitoring of subjects or events.
Steps in the Quantitative Research Process
Quantitative research relies on numerical data to understand patterns and test hypotheses. It uses structured methods to collect measurable information that can be statistically analyzed.
The steps in the quantitative research process begin with identifying a clear research problem and formulating hypotheses. Next, researchers design the study, selecting appropriate sampling techniques and data collection tools. Finally, data analysis and interpretation help to draw conclusions and validate the hypotheses.
Quantitative vs. Qualitative: Key Differences
Quantitative research involves collecting and analyzing numerical data to identify patterns, measure variables, and test hypotheses. It emphasizes objectivity and statistical analysis to produce quantifiable results.
Qualitative research explores non-numerical data like opinions, behaviors, and experiences to gain deeper understanding and insights. It focuses on context, meaning, and subjective interpretation through methods like interviews and observations.
Popular Quantitative Analysis Techniques
What are the most popular quantitative analysis techniques used today? Quantitative analysis involves the use of mathematical and statistical methods to evaluate numerical data. These techniques help businesses, researchers, and analysts make data-driven decisions efficiently.
Which techniques are commonly used for statistical analysis? Descriptive statistics summarize data using measures like mean, median, and standard deviation. Inferential statistics allow analysts to make predictions or generalizations about a population based on sample data.
How does regression analysis support quantitative evaluation? Regression analysis identifies relationships between dependent and independent variables. This technique is essential for forecasting trends and measuring the impact of one variable on another.
Why is time series analysis important in quantitative studies? Time series analysis examines data points collected or recorded at specific time intervals. It helps detect patterns, seasonal variations, and long-term trends in financial markets and economics.
What role does Monte Carlo simulation play in quantitative methods? Monte Carlo simulation uses repeated random sampling to understand the impact of risk and uncertainty in predictive models. This approach is widely applied in finance, engineering, and project management.
Benefits of Quantitative Research
Quantitative research offers precise, numerical data that supports objective analysis and decision-making. It enables the identification of patterns and trends through statistical methods, enhancing the reliability of results. This approach facilitates large-scale data collection, allowing for generalization across populations.
Challenges in Quantitative Studies
Quantitative studies face several challenges that can impact the accuracy and reliability of the data collected. Ensuring large enough sample sizes and representative populations is crucial to avoid biases and generalization errors.
Data measurement and instrumentation issues also present difficulties, as improper tools or inconsistent measurement techniques can skew results. Additionally, handling missing data and addressing confounding variables require rigorous statistical approaches to maintain study validity.