Quantitative research uses numerical data to identify patterns and test hypotheses through statistical analysis. Infographics effectively visualize complex datasets, making insights more accessible and easier to understand. This approach enhances data-driven decision-making by presenting clear, concise information at a glance.
Understanding Quantitative Research
Quantitative research involves the systematic investigation of phenomena through the collection and analysis of numerical data. It aims to quantify variables and uncover patterns or correlations.
This research method uses structured tools like surveys, experiments, and questionnaires to gather measurable data. Statistical techniques help analyze the data, providing objective results that support decision-making. Quantitative research is widely used in fields such as social sciences, marketing, and health studies to test hypotheses and validate theories.
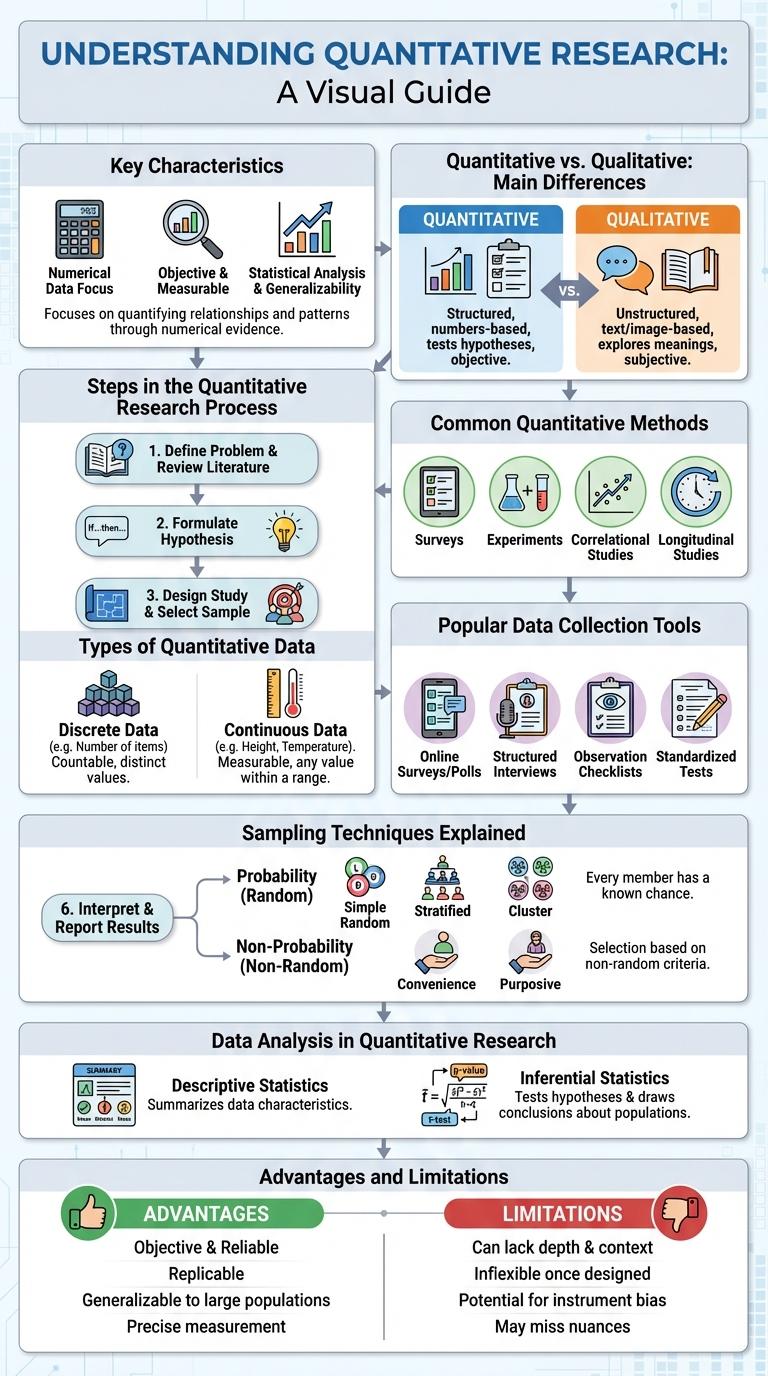
Key Characteristics of Quantitative Research
Quantitative research involves the systematic investigation of phenomena by collecting numerical data and using statistical methods. It aims to quantify variables and generalize results from a sample to a population.
- Objectivity - Quantitative research emphasizes unbiased measurement and analysis through standardized procedures.
- Structured Data Collection - Data is gathered using predefined instruments such as surveys, questionnaires, or experiments.
- Statistical Analysis - Data is analyzed using mathematical techniques to identify patterns, relationships, and make predictions.
Quantitative vs. Qualitative: Main Differences
Quantitative research focuses on numerical data and statistical analysis to understand patterns and relationships. It relies on measurable data to formulate facts and uncover trends in research.
Qualitative research emphasizes understanding human behavior and experiences through non-numerical data like interviews and observations. It provides in-depth insights by exploring meanings and motivations behind actions.
| Aspect | Quantitative vs. Qualitative |
|---|---|
| Data Type | Numerical vs. Textual |
| Purpose | Measure and quantify vs. Explore and understand |
| Methods | Surveys, experiments vs. Interviews, focus groups |
| Analysis | Statistical, mathematical vs. Thematic, content |
| Outcome | Generalizable results vs. Detailed narratives |
Common Quantitative Methods
| Quantitative Method | Description |
|---|---|
| Survey Research | Collects numerical data through structured questionnaires to analyze trends and patterns among populations. |
| Experimental Research | Involves controlled testing of hypotheses by manipulating variables to determine causal relationships. |
| Correlational Research | Examines the strength and direction of relationships between two or more variables without manipulating them. |
| Longitudinal Study | Tracks the same subjects over an extended period to observe changes and developments in variables. |
| Cross-Sectional Study | Analyzes data from a population at a single point in time to identify prevalence or relationships. |
Steps in the Quantitative Research Process
Quantitative research involves systematic investigation to quantify variables and analyze numerical data. It provides measurable evidence to support or refute hypotheses.
- Identify Research Problem - Define a clear and focused research question or hypothesis to guide the study.
- Design Research Plan - Develop a structured plan including data collection methods, sampling, and analysis techniques.
- Collect Data - Gather numerical data using surveys, experiments, or existing datasets for statistical examination.
- Analyze Data - Use statistical tools to interpret data, identify patterns, and test hypotheses.
- Report Findings - Present results in a clear, concise manner with visual aids like graphs and tables.
Following these steps ensures rigor and validity in quantitative research outcomes.
Types of Quantitative Data
Quantitative research relies on numerical data to identify patterns, measure variables, and test hypotheses. Types of quantitative data include discrete data, which consists of countable values, and continuous data, which encompasses measurable quantities. Understanding these data types helps in selecting appropriate statistical methods and ensuring accurate analysis.
Popular Data Collection Tools
What are the most popular data collection tools used in quantitative research? Quantitative research relies on structured methods to collect numerical data for statistical analysis. Common tools ensure accuracy and consistency for large sample sizes.
| Tool | Description |
|---|---|
| Surveys | Standardized questionnaires distributed online, by phone, or in person to gather measurable responses. |
| Structured Interviews | Predefined questions asked in a uniform manner to produce comparable data. |
| Observations | Systematic recording of behaviors or events using checklists or rating scales. |
| Experiments | Controlled testing environments designed to measure variable effects quantitatively. |
| Secondary Data | Pre-existing datasets such as government statistics or organizational records analyzed for research. |
Sampling Techniques Explained
Quantitative research relies heavily on sampling techniques to gather data that represents a larger population accurately. These techniques ensure the collected data is both reliable and valid for statistical analysis.
Common sampling methods include random sampling, stratified sampling, cluster sampling, systematic sampling, and convenience sampling. Each method serves different research needs based on the study's design and target population.
Data Analysis in Quantitative Research
Data analysis in quantitative research involves the systematic examination of numerical data to uncover patterns, test hypotheses, and draw conclusions. Techniques such as statistical tests, regression analysis, and data visualization tools help interpret large datasets effectively. Accurate data analysis ensures reliable results, supporting evidence-based decision-making in various fields.