Infographics about people visually represent demographic data, social trends, and behavioral patterns in a concise and engaging format. They highlight key statistics such as age distribution, cultural diversity, and population growth, making complex information accessible. This visual approach enhances understanding and supports data-driven decisions across various fields.
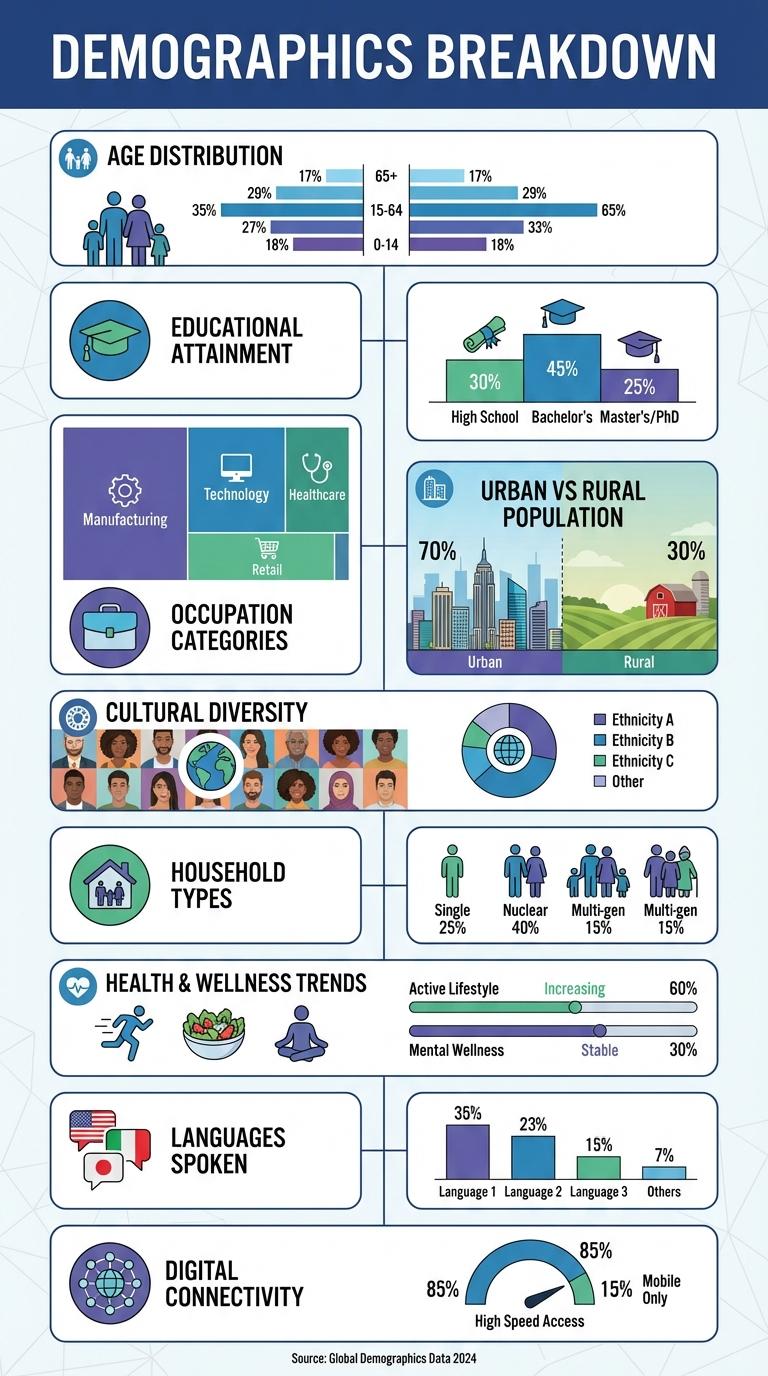
Demographics Breakdown
| Demographic Category | Percentage |
|---|---|
| Age 18-24 | 15% |
| Age 25-34 | 28% |
| Age 35-44 | 22% |
| Age 45-54 | 18% |
| Age 55+ | 17% |
Age Distribution
Age distribution provides insight into the demographic composition of a population. It highlights the proportion of individuals within different age groups, from young children to elderly adults.
Understanding age distribution helps policymakers allocate resources effectively and plan for future social services. A balanced age distribution supports sustainable economic growth by ensuring a steady workforce. Shifts towards an aging population can indicate upcoming challenges in healthcare and pension systems.
Educational Attainment
Educational attainment plays a crucial role in shaping an individual's opportunities and earning potential. It reflects the highest level of education a person has completed, ranging from no formal education to advanced degrees.
Statistics show that higher educational attainment generally correlates with better employment prospects and higher income levels. Governments and organizations use this data to develop policies that promote education and workforce development.
Occupation Categories
Occupation categories illustrate the diverse professional fields where people contribute their expertise and skills. Understanding these categories helps identify economic trends and workforce distributions.
- Healthcare Professionals - Medical practitioners, nurses, and therapists provide essential health services and improve community wellness.
- Technology Specialists - Software developers, IT managers, and engineers drive innovation and maintain digital infrastructures.
- Education Workers - Teachers, professors, and trainers shape knowledge and nurture future generations.
Occupational categories reflect societal needs and ongoing changes in job markets worldwide.
Urban vs Rural Population
The global population is increasingly urban, with over 56% living in cities as of 2023. Urban areas offer more job opportunities, healthcare, and education compared to rural regions. Rural populations tend to have lower access to infrastructure but contribute significantly to agriculture and natural resource management.
Cultural Diversity
Cultural diversity enriches communities by bringing a wide range of perspectives and experiences. It fosters creativity and innovation through the blending of different traditions and ideas.
- Global Population - Over 7.9 billion people worldwide represent thousands of distinct cultural groups.
- Language Variety - More than 7,000 languages are spoken, reflecting diverse communication styles and histories.
- Migration Impact - Migration has increased cultural exchange, contributing to multicultural societies across continents.
Household Types
What are the most common household types worldwide? Household types vary widely but typically include nuclear families, single-person households, and extended families. Understanding these types helps in planning social services and housing policies.
| Household Type | Description |
|---|---|
| Nuclear Family | Two parents and their children living together. |
| Single-Person | One individual living alone. |
| Extended Family | Multiple generations living under one roof. |
| Shared Household | Unrelated individuals living together. |
Health & Wellness Trends
The Health & Wellness sector is rapidly evolving with a focus on holistic well-being, including mental health, nutrition, and fitness. Consumers increasingly prioritize natural products, personalized wellness plans, and digital health tools.
Wearable technology usage for health monitoring has risen by 40% in the past two years, highlighting a shift toward proactive self-care. Plant-based diets and mindfulness practices also dominate the wellness landscape, reflecting a growing awareness of sustainable and mental health approaches.
Languages Spoken
Over 7,000 languages are spoken worldwide, showcasing the rich linguistic diversity among people. Mandarin Chinese, Spanish, and English are the top three most spoken languages by the number of native speakers. Multilingualism is common, with many individuals speaking two or more languages fluently.