Quadratic inequalities involve algebraic expressions where a quadratic function is compared using inequality symbols such as <, >, <=, or >=. Solving these inequalities requires identifying the regions on the coordinate plane where the quadratic expression holds true, often visualized through graphs. Infographics effectively illustrate these solutions by combining equations, graphs, and step-by-step processes to enhance understanding.
Definition of Quadratic Inequality
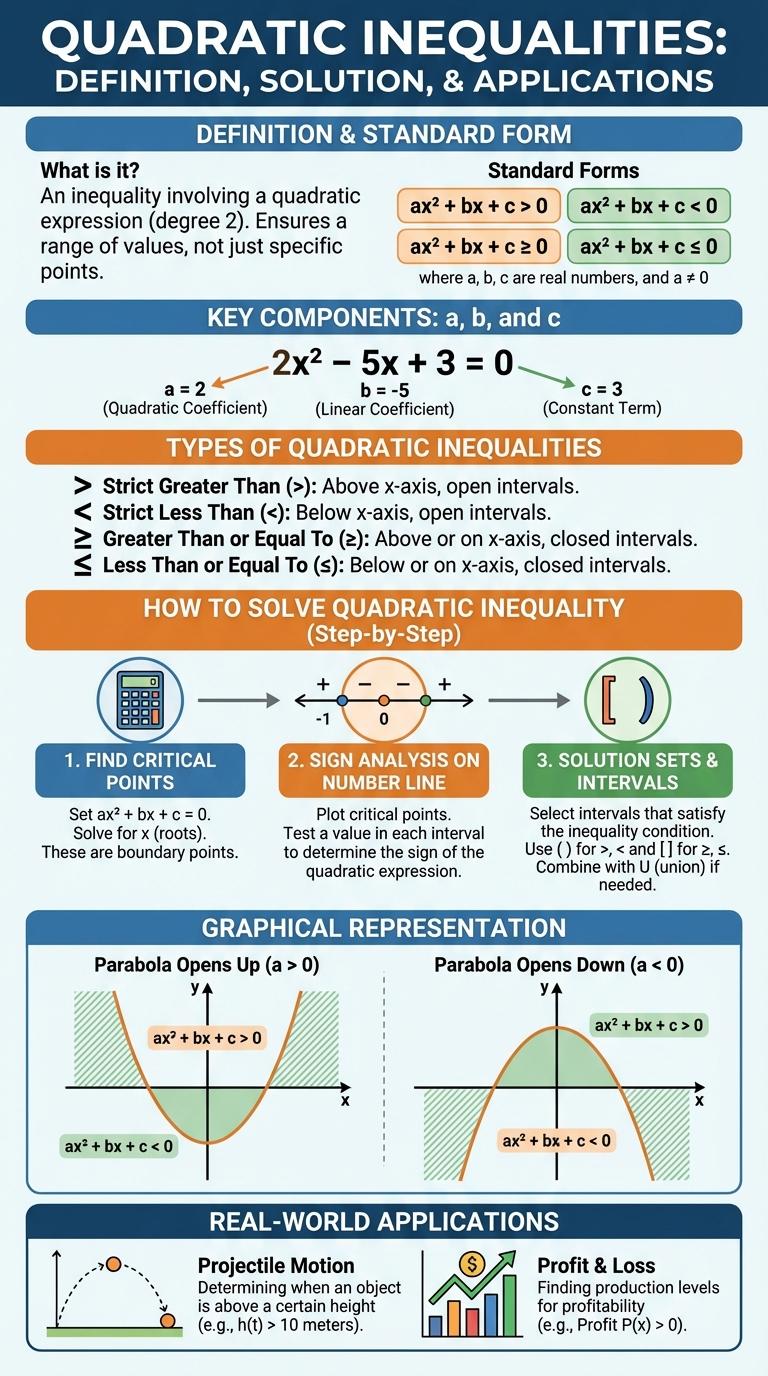
A quadratic inequality is a mathematical expression involving a quadratic function and an inequality sign such as <, >, <=, or >=. It compares the quadratic expression to zero or another value, determining where the function satisfies the inequality.
Quadratic inequalities often take the form ax2 + bx + c < 0 or ax2 + bx + c >= 0, where a, b, and c are constants and a 0. Solving these inequalities involves finding the intervals on the x-axis where the quadratic expression is positive or negative. These solutions describe the set of all x-values that make the inequality true.
Standard Form of Quadratic Inequality
Quadratic inequalities express a relationship where a quadratic expression is compared using inequality signs. The standard form organizes the inequality for easier analysis and solution.
Understanding the standard form helps identify critical points and determine solution intervals effectively.
- Definition - A quadratic inequality in standard form is written as ax2 + bx + c < 0, > 0, <= 0, or >= 0, where a 0.
- Components - The coefficients a, b, and c represent real numbers, with a determining the parabola's opening direction.
- Purpose - Writing the inequality in standard form facilitates graphing and applying test values to find solution sets.
Key Components: a, b, and c
Quadratic inequalities involve expressions of the form ax2 + bx + c < 0, > 0, <= 0, or >= 0, where a, b, and c are real numbers. The coefficient a determines the parabola's direction, upward if a > 0, downward if a < 0. Parameters b and c influence the vertex location and the y-intercept, critical for identifying solution intervals in the inequality.
Types of Quadratic Inequalities
Quadratic inequalities involve expressions where a quadratic function is compared using inequality signs such as <, >, <=, or >=. These inequalities define regions on the graph of a parabola where the quadratic expression satisfies the given condition.
The types of quadratic inequalities include "ax2 + bx + c > 0" and "ax2 + bx + c < 0," representing where the parabola is above or below the x-axis. Variations with ">=" and "<=" include the points on the parabola along with the regions above or below it.
How to Solve Quadratic Inequality
Quadratic inequalities involve expressions where a quadratic polynomial is compared using inequality symbols. Solving these inequalities helps determine the range of values for the variable that satisfy the inequality.
- Identify the inequality type - Recognize whether the inequality is less than, greater than, less than or equal to, or greater than or equal to a certain value.
- Find the roots of the quadratic equation - Solve the corresponding quadratic equation by setting it equal to zero to locate critical points.
- Test intervals between roots - Evaluate the inequality within intervals defined by the roots to determine where the inequality holds true.
Graphing the solution on a number line or coordinate plane visually represents the range satisfying the quadratic inequality.
Graphical Representation
Quadratic inequalities involve expressions of the form ax2 + bx + c > 0 or < 0, where a, b, and c are constants. The solution set is represented graphically by shading regions above or below the parabola defined by the quadratic equation ax2 + bx + c = 0. The parabola opens upwards if a > 0 and downwards if a < 0, which determines where the inequality holds true.
Finding Critical Points
How do you find the critical points in a quadratic inequality? Identify where the quadratic expression equals zero by solving the corresponding quadratic equation. These solutions divide the number line into intervals for testing the inequality's truth value.
Sign Analysis on Number Line
Quadratic inequalities involve determining where a quadratic expression is positive, negative, or zero. Sign analysis on a number line helps visualize the solution by examining the signs of the quadratic expression across intervals defined by its roots.
- Identify Roots - Solve the quadratic equation to find critical points where the expression equals zero.
- Divide Number Line - Use the roots to split the number line into separate intervals for sign testing.
- Test Interval Signs - Evaluate the quadratic expression at a sample point within each interval to determine if the expression is positive or negative there.
Solution Sets and Intervals
| Concept | Description |
|---|---|
| Quadratic Inequality | An inequality involving a quadratic expression: ax2 + bx + c < 0, > 0, <= 0, or >= 0 |
| Solution Set | Values of x making the quadratic inequality true. Represented as intervals on the number line |
| Intervals | Ranges of x defined by roots of the corresponding quadratic equation ax2 + bx + c = 0 |
| Test Points | Chosen from intervals to verify inequality truth value within intervals |
| Interval Notation Example | x (-, r1) (r2, ) where r1 and r2 are roots and inequality is satisfied outside these roots |