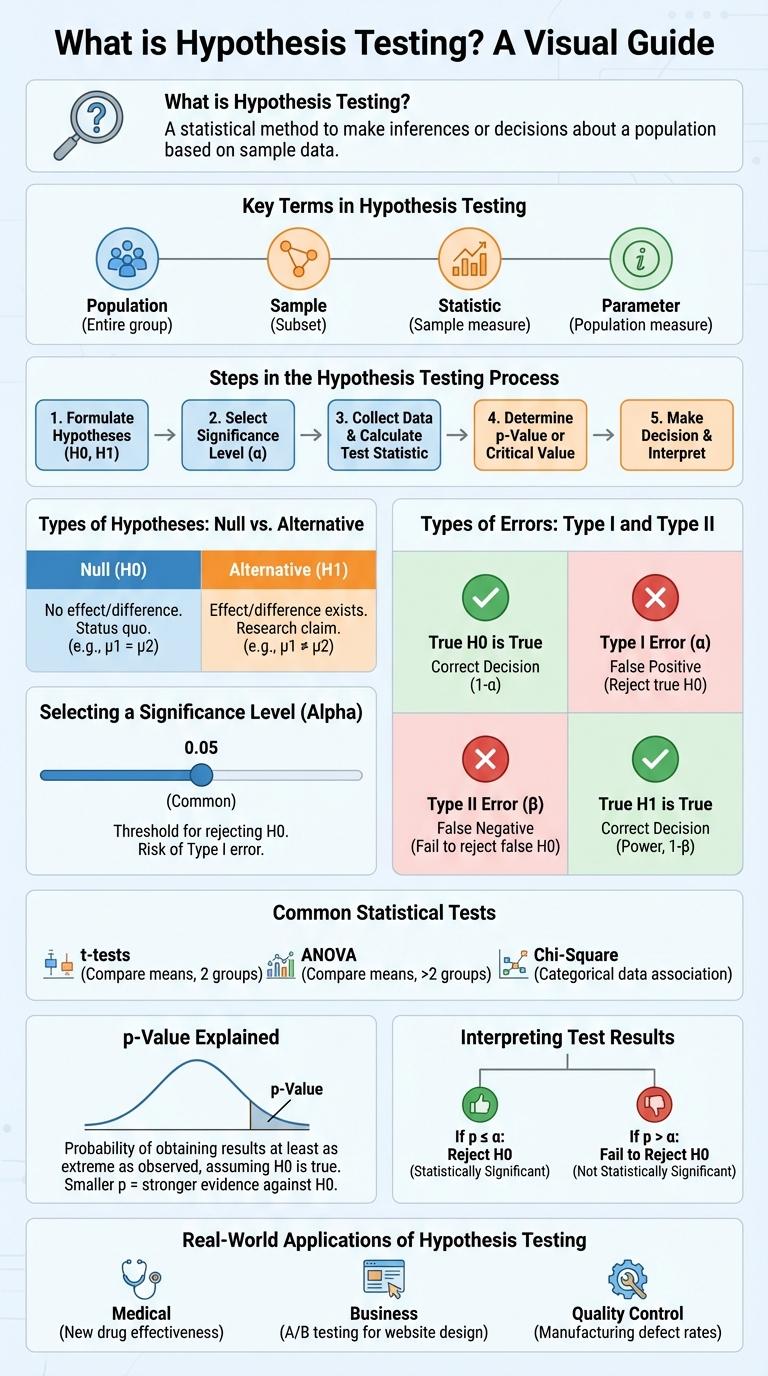
Hypothesis testing is a fundamental statistical method used to make decisions or inferences about population parameters based on sample data. It involves formulating a null hypothesis and an alternative hypothesis, then determining the likelihood of observing the sample results under the null hypothesis. This infographic visually breaks down the key steps and concepts in hypothesis testing, making it easier to understand and apply in various research contexts.
What is Hypothesis Testing?
Hypothesis testing is a statistical method used to make decisions about population parameters based on sample data. It evaluates an assumption called the null hypothesis against an alternative hypothesis.
This process helps determine if observed data deviates significantly from what is expected under the null hypothesis. Results guide whether to reject or fail to reject the null hypothesis, providing insight into the data's underlying patterns.
Key Terms in Hypothesis Testing
Hypothesis testing is a fundamental method in statistics used to make inferences about population parameters based on sample data. It involves several key terms crucial for understanding and conducting tests accurately.
Understanding these terms helps in designing tests, interpreting results, and making data-driven decisions.
- Null Hypothesis (H0) - A statement asserting that there is no effect or difference, serving as the default assumption in hypothesis testing.
- Alternative Hypothesis (H1 or Ha) - A statement indicating the presence of an effect or difference, tested against the null hypothesis.
- Significance Level (a) - The threshold probability for rejecting the null hypothesis, commonly set at 0.05.
- p-value - The probability of obtaining test results at least as extreme as the observed results, assuming the null hypothesis is true.
- Type I Error - The error of rejecting the null hypothesis when it is actually true, also known as a false positive.
Steps in the Hypothesis Testing Process
| Step | Description |
|---|---|
| 1. State Hypotheses | Formulate the null hypothesis (H0) and the alternative hypothesis (H1) based on the research question. |
| 2. Choose Significance Level | Select the alpha level (commonly 0.05) to determine the threshold for rejecting H0. |
| 3. Select Test Statistic | Identify the appropriate statistical test such as t-test, z-test, chi-square test depending on data type and sample size. |
| 4. Calculate Test Statistic | Compute the value of the test statistic using sample data and formulas. |
| 5. Decision and Conclusion | Compare the calculated value with critical value or p-value; reject or fail to reject H0 and interpret results in context. |
Types of Hypotheses: Null vs. Alternative
Hypothesis testing is a statistical method used to make decisions about population parameters based on sample data. It involves comparing two competing hypotheses: the null hypothesis and the alternative hypothesis.
The null hypothesis represents the default assumption or no effect situation, while the alternative hypothesis reflects the presence of an effect or difference.
- Null Hypothesis (H0) - Assumes no significant difference or effect exists in the population.
- Alternative Hypothesis (H1 or Ha) - Suggests a significant difference or effect is present.
- Role in Testing - Statistical tests aim to reject the null hypothesis in favor of the alternative based on sample evidence.
Selecting a Significance Level (Alpha)
Choosing the significance level, or alpha, is a critical step in hypothesis testing that determines the threshold for rejecting the null hypothesis. The selected alpha impacts the probability of committing a Type I error in statistical analysis.
- Definition of Alpha - Alpha represents the maximum acceptable probability of falsely rejecting the null hypothesis when it is true.
- Common Values - Typical significance levels include 0.05, 0.01, and 0.10, each reflecting different tolerances for risk.
- Impact on Results - Lower alpha values reduce Type I error risk but increase the chance of Type II errors, affecting test sensitivity.
Careful consideration of the significance level ensures a balanced approach between identifying true effects and minimizing false positives.
Types of Errors: Type I and Type II
What are the main types of errors in hypothesis testing? Hypothesis testing primarily involves two types of errors: Type I and Type II errors. Type I error occurs when a true null hypothesis is incorrectly rejected, while Type II error happens when a false null hypothesis is not rejected.
How do Type I and Type II errors impact decision-making in hypothesis testing? Type I error represents a false positive, leading to incorrect conclusions that an effect exists. Type II error is a false negative, causing researchers to miss detecting a real effect, which affects the study's power and reliability.
Common Statistical Tests
Hypothesis testing is a fundamental procedure in statistics used to determine if there is enough evidence to support a specific claim about a population. Common statistical tests include the t-test, chi-square test, ANOVA, Mann-Whitney U test, and Pearson correlation test, each serving different data types and research questions. These tests help researchers validate assumptions and draw conclusions based on sample data.
| Statistical Test | Purpose |
|---|---|
| T-test | Compare means between two groups |
| Chi-square Test | Assess relationships between categorical variables |
| ANOVA | Compare means among three or more groups |
| Mann-Whitney U Test | Compare differences between two independent groups (non-parametric) |
| Pearson Correlation | Measure linear relationship between two variables |
p-Value Explained
Hypothesis testing evaluates a claim about a population parameter using sample data. The p-value measures the probability of observing the data, or something more extreme, assuming the null hypothesis is true. A low p-value indicates strong evidence against the null hypothesis, suggesting it may be rejected.
Interpreting Test Results
Hypothesis testing evaluates whether sample data provides enough evidence to reject a null hypothesis. The results indicate if an observed effect is statistically significant or likely due to chance.
Interpreting test results involves comparing the p-value to a predefined significance level (alpha). A p-value less than alpha leads to rejecting the null hypothesis, while a larger p-value means insufficient evidence to reject it.