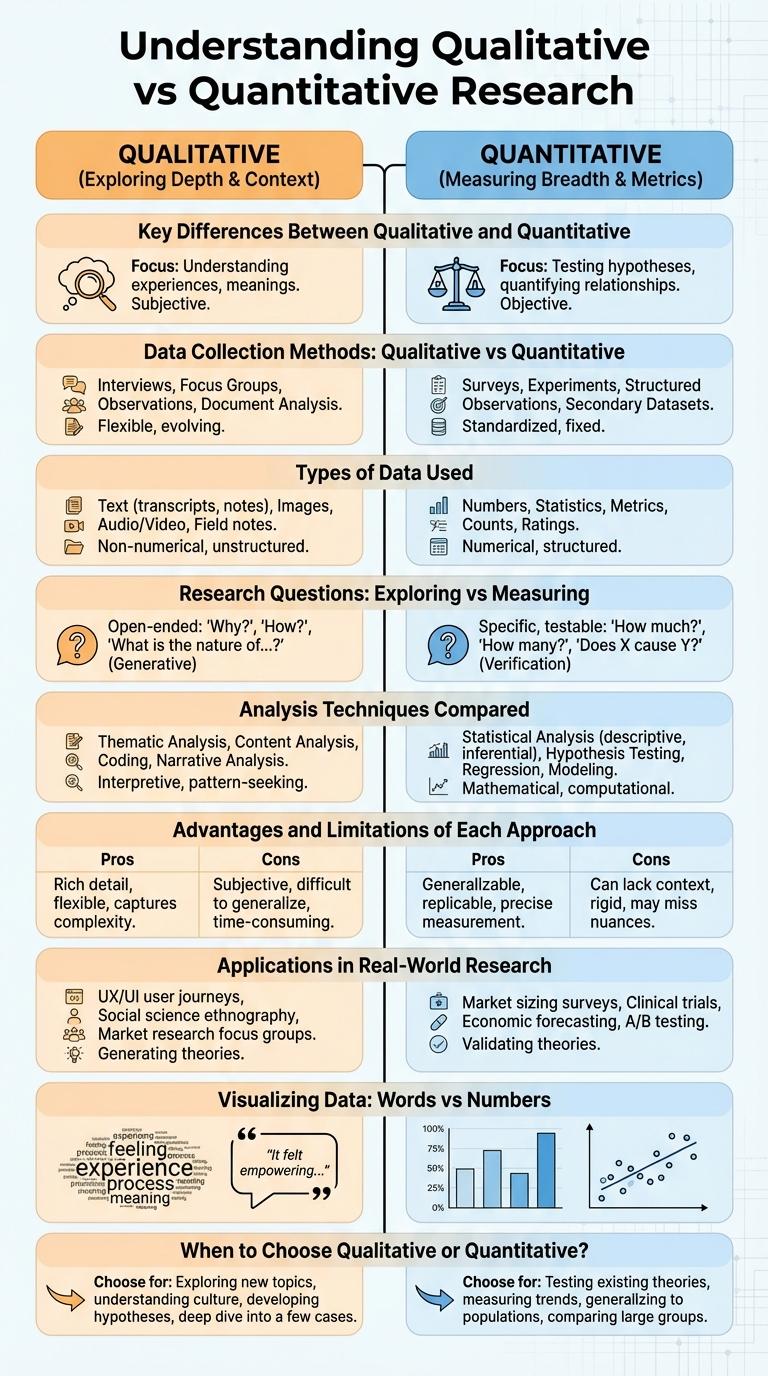
Qualitative and quantitative research methods offer distinct approaches for gathering and analyzing data, each with unique strengths and applications. Qualitative research focuses on exploring concepts, experiences, and meanings through detailed, descriptive data. Quantitative research emphasizes numerical data and statistical analysis to identify patterns and test hypotheses.
Understanding Qualitative vs Quantitative Research
Qualitative research explores phenomena through detailed, non-numerical data, focusing on understanding meanings, experiences, and concepts. It uses methods like interviews, focus groups, and observations to gather in-depth insights.
Quantitative research involves the collection and analysis of numerical data to identify patterns, test hypotheses, and make predictions. Surveys, experiments, and statistical analysis are common tools used to measure and quantify variables.
Key Differences Between Qualitative and Quantitative
Qualitative and quantitative research methods serve distinct purposes in data collection and analysis. Understanding their key differences helps in selecting the appropriate approach for specific research goals.
- Data Type - Qualitative research collects non-numerical data like opinions and experiences, while quantitative research gathers numerical data for statistical analysis.
- Purpose - Qualitative methods explore underlying reasons and motivations, whereas quantitative methods measure and quantify variables.
- Data Collection Techniques - Qualitative uses interviews and focus groups, quantitative relies on surveys and experiments.
- Outcome - Qualitative results provide in-depth understanding, quantitative results offer generalizable findings.
- Analysis - Qualitative analysis is interpretative, quantitative analysis involves mathematical and statistical procedures.
Data Collection Methods: Qualitative vs Quantitative
Qualitative and quantitative data collection methods serve distinct purposes in research, each providing unique insights. Understanding their differences is crucial for selecting the appropriate approach.
- Qualitative Methods - Involve collecting non-numerical data through interviews, focus groups, and observations to explore experiences and perceptions.
- Quantitative Methods - Utilize structured tools like surveys and experiments to gather numerical data for statistical analysis and pattern identification.
- Data Depth vs. Breadth - Qualitative methods offer deep, detailed understanding, while quantitative methods provide broad, generalizable results.
Choosing between qualitative and quantitative data collection methods depends on the research goals and the type of data needed.
Types of Data Used
Qualitative and quantitative research methods differ primarily in the types of data they use to analyze information. Understanding these data types helps in choosing the appropriate approach for specific research goals.
- Qualitative Data - Consists of non-numerical information such as words, images, or objects that capture meanings and experiences.
- Quantitative Data - Comprises numerical values that can be measured and statistically analyzed, like counts or percentages.
- Data Collection Methods - Qualitative data is often gathered through interviews and observations; quantitative data is collected via surveys, experiments, or instruments with numerical outputs.
Research Questions: Exploring vs Measuring
Research questions in qualitative studies focus on exploring deeper meanings, experiences, and motivations behind phenomena. Quantitative research questions aim at measuring variables and testing hypotheses through numerical data.
Qualitative research explores "how" and "why" questions, providing rich, detailed insights into complex issues. Quantitative research addresses "what," "where," and "when" questions by quantifying data for statistical analysis. Both approaches complement each other by offering comprehensive perspectives on research problems.
Analysis Techniques Compared
Qualitative analysis focuses on exploring patterns, themes, and meanings within non-numerical data such as interviews or observations. Techniques include thematic analysis, content analysis, and narrative analysis, which provide deep insights into participant experiences and perceptions.
Quantitative analysis involves numerical data and statistical methods to test hypotheses or quantify variables. Common techniques include descriptive statistics, inferential statistics, regression analysis, and correlation analysis, enabling objective measurement and comparison.
Advantages and Limitations of Each Approach
| Qualitative Approach | Quantitative Approach |
|---|---|
Advantages
|
Advantages
|
Limitations
|
Limitations
|
Applications in Real-World Research
Qualitative research is widely used in social sciences to explore human behavior, attitudes, and experiences through interviews and focus groups. Quantitative research applies numerical data analysis in fields like epidemiology, market research, and psychology to identify patterns and test hypotheses. Both methods complement each other in real-world research by providing depth and statistical validation.
Visualizing Data: Words vs Numbers
How do qualitative and quantitative data differ in visualization? Qualitative data uses descriptive words to represent concepts and experiences. Quantitative data relies on numbers and statistics to illustrate measurable information.
What makes qualitative data visualization unique? It emphasizes themes, patterns, and narratives through charts like word clouds or thematic maps. This approach captures context and subjective insights effectively.
Why is quantitative data visualization powerful? It transforms numerical data into graphs, charts, or tables for easy comparison and trend analysis. Precise measurements and statistical relationships become clear and actionable.
Which types of visuals suit qualitative data best? Infographics with color-coded categories, quotes, and concept maps help communicate complex ideas. These visuals highlight the richness of human experiences and opinions.
How can quantitative visualization enhance decision-making? Bar charts, histograms, and scatter plots reveal distribution, frequency, and correlations. Organizations leverage numeric clarity to drive strategies based on data-driven evidence.